![[OC] How 118th Congress Performed: Grade Distribution Senators and Representatives](https://www.europesays.com/wp-content/uploads/2025/06/5013arx2co6f1-1290x1024.jpeg)
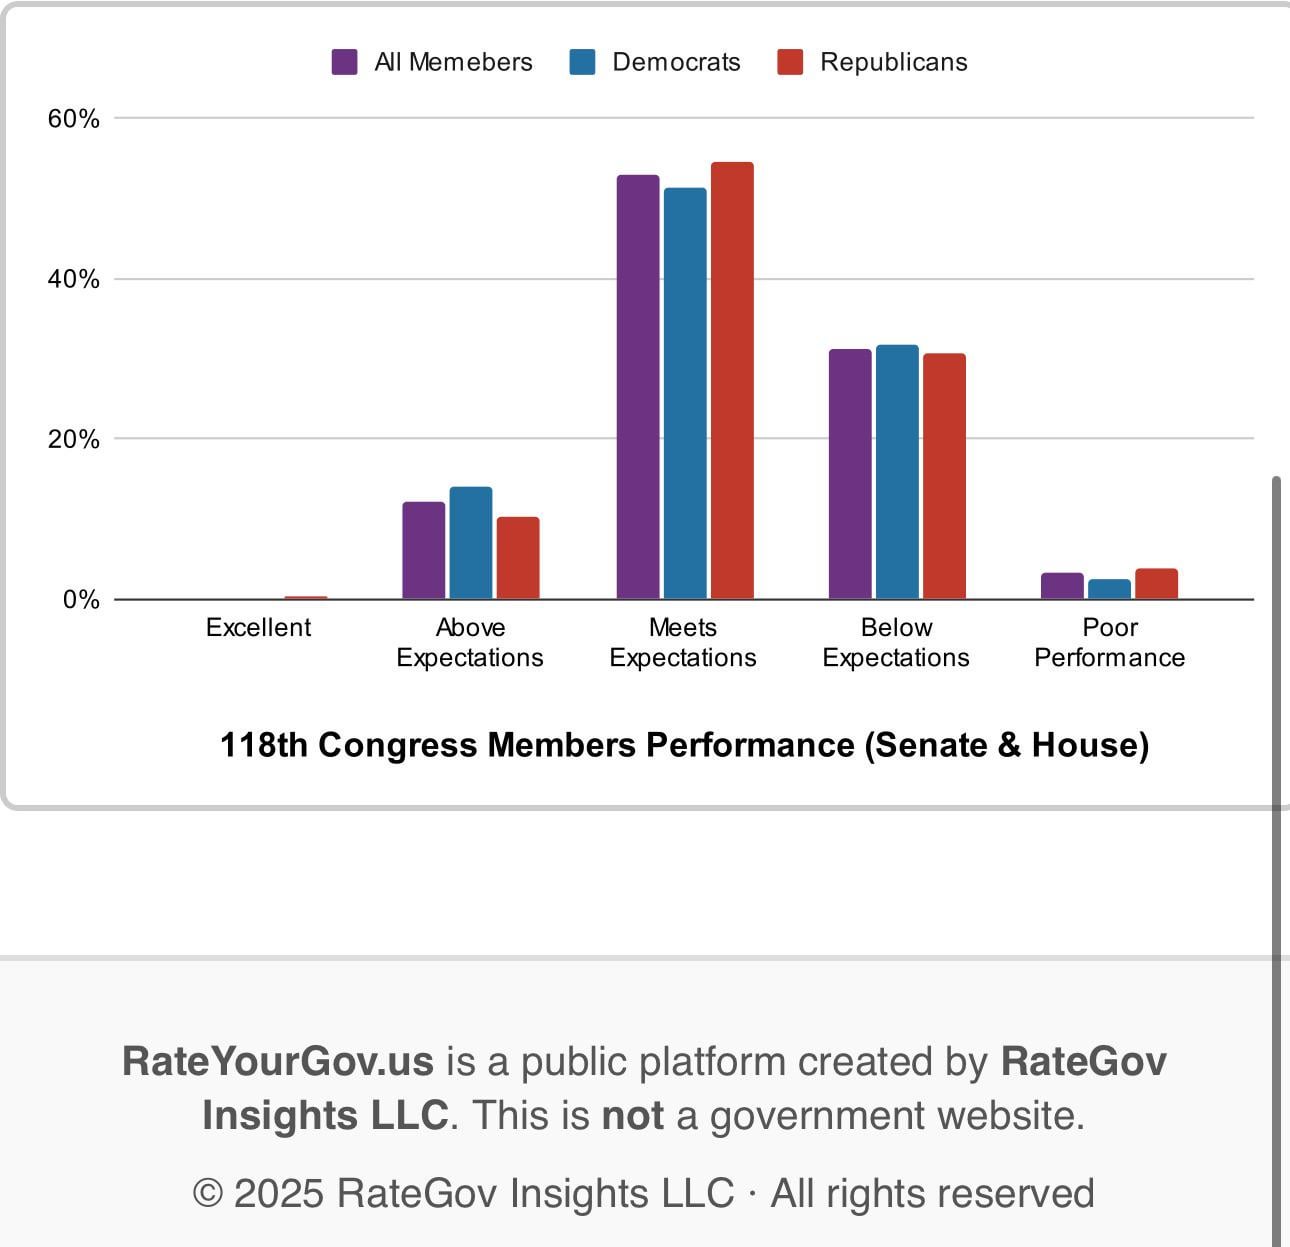
This chart shows the grade distribution of the 118th Congress. The grades are based on Legislative impact, Independence, Issue alignment and Constituents services.
Grades were calculated using a structured nonpartisan evaluation system using trusted real world data.
We hope this kind of data can spark deeper civic discussions – beyond party lines – about how well our leaders are actually doing.
Built as part of the RateYourGov MVP project – more context and full grades of several leaders from 117th and 118th Congress at RateYourGov.
Let me know what you think – feedback and questions welcome!
Posted by RateYourGov
7 comments
You guys must have some very low expectations.
There seems to be a single republican who got excellent.
Who’s that?
“Trusted real world data”, such as?
This post without a description of the criteria isn’t useful.
Who the fuck has any expectations other than holy fuck you guys suck (and yes. That means your favorite party too. Its all one big club, and we ain’t in it.)
Never seen more suspect data in my fuckin life lmfao
What factors are being considered? Cuz from my point of view they all get poor performance currently.
Yeah man, you’re gonna need to actually cite your sources.
My expectations are shit poor performance. They met those expectations. So which am I supposed to put?
Comments are closed.