
Jun 16, 2025
IndexBox has just published a new report: China – Hydrogen – Market Analysis, Forecast, Size, Trends And Insights.
The hydrogen market in China is driven by increasing demand, with forecasts indicating a steady upward consumption trend for the period from 2024 to 2035. Market performance is expected to expand with a projected CAGR of +1.0% in volume, reaching 5.5B cubic meters by 2035. In terms of value, the market is forecasted to increase with an anticipated CAGR of +1.3%, culminating in a market value of $2.5B by the end of 2035.
Market Forecast
Driven by increasing demand for hydrogen in China, the market is expected to continue an upward consumption trend over the next decade. Market performance is forecast to decelerate, expanding with an anticipated CAGR of +1.0% for the period from 2024 to 2035, which is projected to bring the market volume to 5.5B cubic meters by the end of 2035.
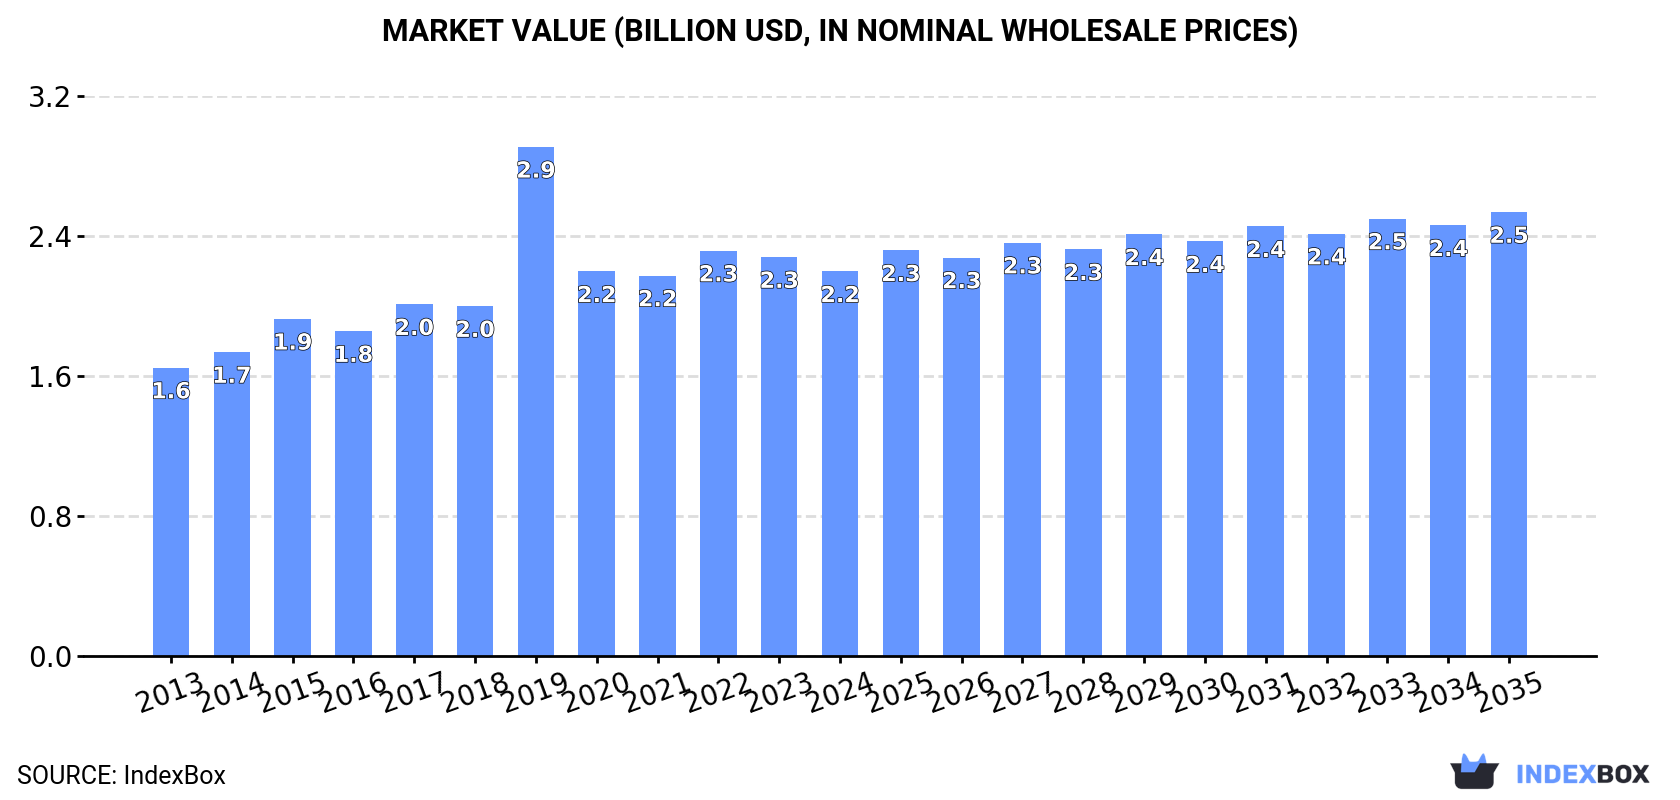
In value terms, the market is forecast to increase with an anticipated CAGR of +1.3% for the period from 2024 to 2035, which is projected to bring the market value to $2.5B (in nominal wholesale prices) by the end of 2035.
 ConsumptionChina’s Consumption of Hydrogen
In 2024, consumption of hydrogen decreased by -1% to 4.9B cubic meters, falling for the second consecutive year after ten years of growth. The total consumption volume increased at an average annual rate of +1.8% from 2013 to 2024; the trend pattern remained consistent, with somewhat noticeable fluctuations in certain years. Hydrogen consumption peaked at 5B cubic meters in 2022; however, from 2023 to 2024, consumption stood at a somewhat lower figure.
The size of the hydrogen market in China fell slightly to $2.2B in 2024, dropping by -3.6% against the previous year. This figure reflects the total revenues of producers and importers (excluding logistics costs, retail marketing costs, and retailers’ margins, which will be included in the final consumer price). In general, the total consumption indicated notable growth from 2013 to 2024: its value increased at an average annual rate of +2.7% over the last eleven years. The trend pattern, however, indicated some noticeable fluctuations being recorded throughout the analyzed period. Based on 2024 figures, consumption decreased by -5.1% against 2022 indices. As a result, consumption reached the peak level of $2.9B. From 2020 to 2024, the growth of the market remained at a lower figure.
ProductionChina’s Production of Hydrogen
In 2024, production of hydrogen decreased by -1% to 4.9B cubic meters, falling for the second year in a row after ten years of growth. The total output volume increased at an average annual rate of +1.8% from 2013 to 2024; the trend pattern remained consistent, with only minor fluctuations being recorded throughout the analyzed period. The most prominent rate of growth was recorded in 2014 when the production volume increased by 4.2% against the previous year. Over the period under review, production attained the maximum volume at 5B cubic meters in 2022; however, from 2023 to 2024, production failed to regain momentum.
In value terms, hydrogen production fell to $2.2B in 2024 estimated in export price. Overall, the total production indicated temperate growth from 2013 to 2024: its value increased at an average annual rate of +3.2% over the last eleven years. The trend pattern, however, indicated some noticeable fluctuations being recorded throughout the analyzed period. Based on 2024 figures, production decreased by -7.2% against 2022 indices. The pace of growth appeared the most rapid in 2019 when the production volume increased by 74% against the previous year. As a result, production reached the peak level of $3.4B. From 2020 to 2024, production growth failed to regain momentum.
ImportsChina’s Imports of Hydrogen
After two years of growth, purchases abroad of hydrogen decreased by -99.3% to 34 cubic meters in 2024. Over the period under review, imports continue to indicate a sharp decrease. The pace of growth appeared the most rapid in 2016 with an increase of 20,885%. As a result, imports reached the peak of 23K cubic meters. From 2017 to 2024, the growth of imports failed to regain momentum.
In value terms, hydrogen imports shrank sharply to $358K in 2024. Overall, imports, however, enjoyed a significant increase. The growth pace was the most rapid in 2023 when imports increased by 6,886%. As a result, imports attained the peak of $433K, and then contracted notably in the following year.
Imports By Country
In 2024, France (34 cubic meters) was the main supplier of hydrogen to China, accounting for a approx. 100% share of total imports.
From 2013 to 2024, the average annual rate of growth in terms of volume from France amounted to -61.1%.
In value terms, France ($358K) constituted the largest supplier of hydrogen to China.
From 2013 to 2024, the average annual growth rate of value from France was relatively modest.
Import Prices By Country
The average hydrogen import price stood at $11 thousand per cubic meter in 2024, growing by 11,120% against the previous year. Overall, the import price saw a significant expansion. As a result, import price attained the peak level and is likely to continue growth in the immediate term.
As there is only one major supplying country, the average price level is determined by prices for France.
From 2013 to 2024, the rate of growth in terms of prices for France amounted to +158.0% per year.
ExportsChina’s Exports of Hydrogen
In 2024, exports of hydrogen from China skyrocketed to 59K cubic meters, with an increase of 16% on the previous year. Over the period under review, exports continue to indicate a resilient expansion. The growth pace was the most rapid in 2019 when exports increased by 2,660% against the previous year. As a result, the exports reached the peak of 799K cubic meters. From 2020 to 2024, the growth of the exports remained at a lower figure.
In value terms, hydrogen exports skyrocketed to $248K in 2024. In general, exports showed a buoyant increase. The most prominent rate of growth was recorded in 2019 with an increase of 3,764% against the previous year. As a result, the exports attained the peak of $4M. From 2020 to 2024, the growth of the exports remained at a somewhat lower figure.
Exports By Country
Hong Kong SAR (32K cubic meters) was the main destination for hydrogen exports from China, accounting for a 54% share of total exports. Moreover, hydrogen exports to Hong Kong SAR exceeded the volume sent to the second major destination, Bangladesh (6.1K cubic meters), fivefold. Macao SAR (3.5K cubic meters) ranked third in terms of total exports with a 5.9% share.
From 2013 to 2024, the average annual rate of growth in terms of volume to Hong Kong SAR stood at +5.3%. Exports to the other major destinations recorded the following average annual rates of exports growth: Bangladesh (+62.8% per year) and Macao SAR (+51.0% per year).
In value terms, Hong Kong SAR ($52K), Macao SAR ($44K) and Myanmar ($23K) were the largest markets for hydrogen exported from China worldwide, with a combined 48% share of total exports.
In terms of the main countries of destination, Macao SAR, with a CAGR of +67.6%, saw the highest rates of growth with regard to the value of exports, over the period under review, while shipments for the other leaders experienced more modest paces of growth.
Export Prices By Country
The average hydrogen export price stood at $4.2 per cubic meter in 2024, approximately reflecting the previous year. In general, the export price enjoyed a moderate increase. The most prominent rate of growth was recorded in 2020 an increase of 1,221%. As a result, the export price attained the peak level of $66 per cubic meter. From 2021 to 2024, the average export prices failed to regain momentum.
There were significant differences in the average prices for the major overseas markets. In 2024, amid the top suppliers, the country with the highest price was Myanmar ($46 per cubic meter), while the average price for exports to the UK ($742 per thousand cubic meters) was amongst the lowest.
From 2013 to 2024, the most notable rate of growth in terms of prices was recorded for supplies to Myanmar (+55.6%), while the prices for the other major destinations experienced more modest paces of growth.