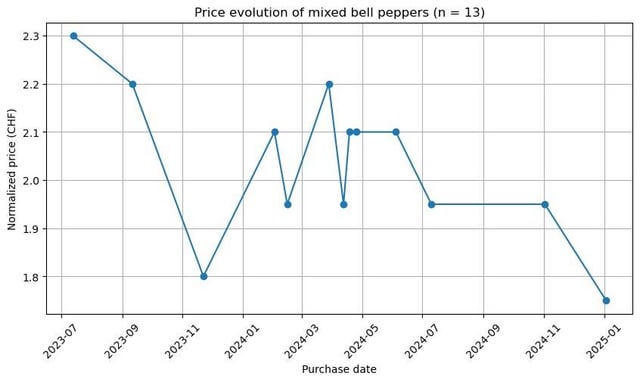
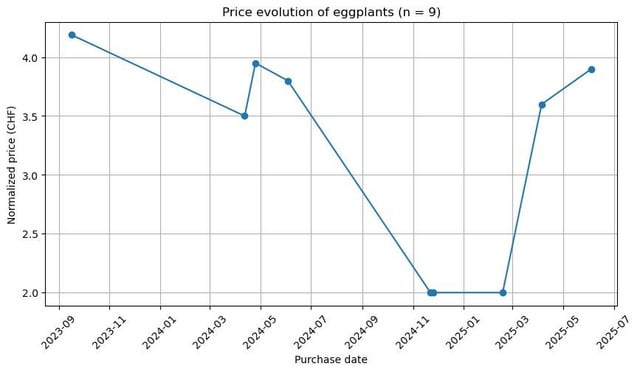
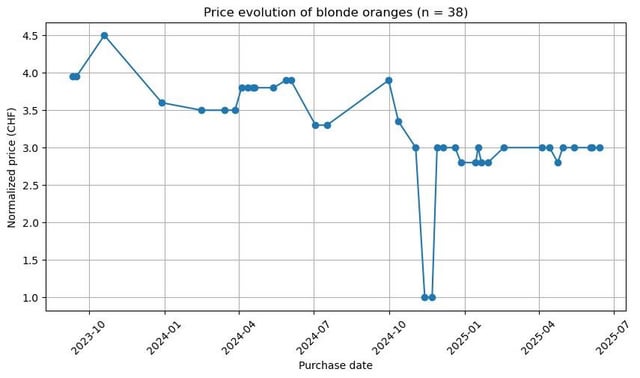
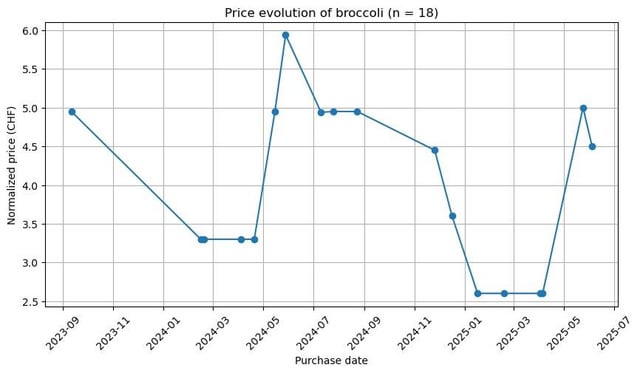
Hi everyone,
I noticed that you can download your Migros purchase data made using the cumulus and I plotted some charts of the prices overs the years.
Is it interesting? Not much but still, have a look !
by Chemical-Gazelle1557
Hi everyone,
I noticed that you can download your Migros purchase data made using the cumulus and I plotted some charts of the prices overs the years.
Is it interesting? Not much but still, have a look !
by Chemical-Gazelle1557
15 comments
Would be so interesting to have this over time from every product
except for the fact that prices are changing over time you can only draw wrong intuitive conclusions out of this chart because every single factor that you’d would need to learn something you don’t have access to
Why is your ordinate more then 1 if you normalise it?
Can it also be that one time you bought an organic broccoli and another time a non-organic one? Or is it certain that it was always the same?
Very interesting! At one point I was trying to use archive.org to track inflation. Old Migros pages don’t always load though.
Just a minor thing, but in my opinion, it would be more appropriate here to use `plt.step` instead of `plt.plot`. Until you have a new price, the old price is valid. There is no gradual shift from the old to the new price
Products such as oranges, peppers and broccoli probably have more of a seasonal influence than an annual trend. Eggs are probably still pandemic-related and political.
Shocking that summer veggies cost more in winter…
r/Switzerland und dir alli redet english ? Was louft mit öich ???!
We need migros ice tea lemon chart
2023 was a crazy time to be alive, huh?
Did you export the data using [this solution](https://migipedia.migros.ch/de/forum/allgemein/export-der-daten?reply=588de800-9589-11e3-a7a7-33da342c6149)?
Looks like one of the factors is the EUR-CHF exchange rate
dont look at the strawberry prices – then you see the tariffs in full effect
Its protectionism.
Tarrifs on Vegetables are higher in summer to protect swiss farmers.
https://www.srf.ch/news/wirtschaft/importzoelle-und-subventionen-warum-gemuese-in-der-schweiz-so-teuer-ist
One example from 2023: 713chf Tariff on tomatoes in summer, 5 chf for the the rest of the year.
Comments are closed.