
Jun 21, 2025
IndexBox has just published a new report: United Kingdom – Fluorides, Fluorosilicates, Fluoroaluminates And Other Complex Fluorine Salts – Market Analysis, Forecast, Size, Trends And Insights.
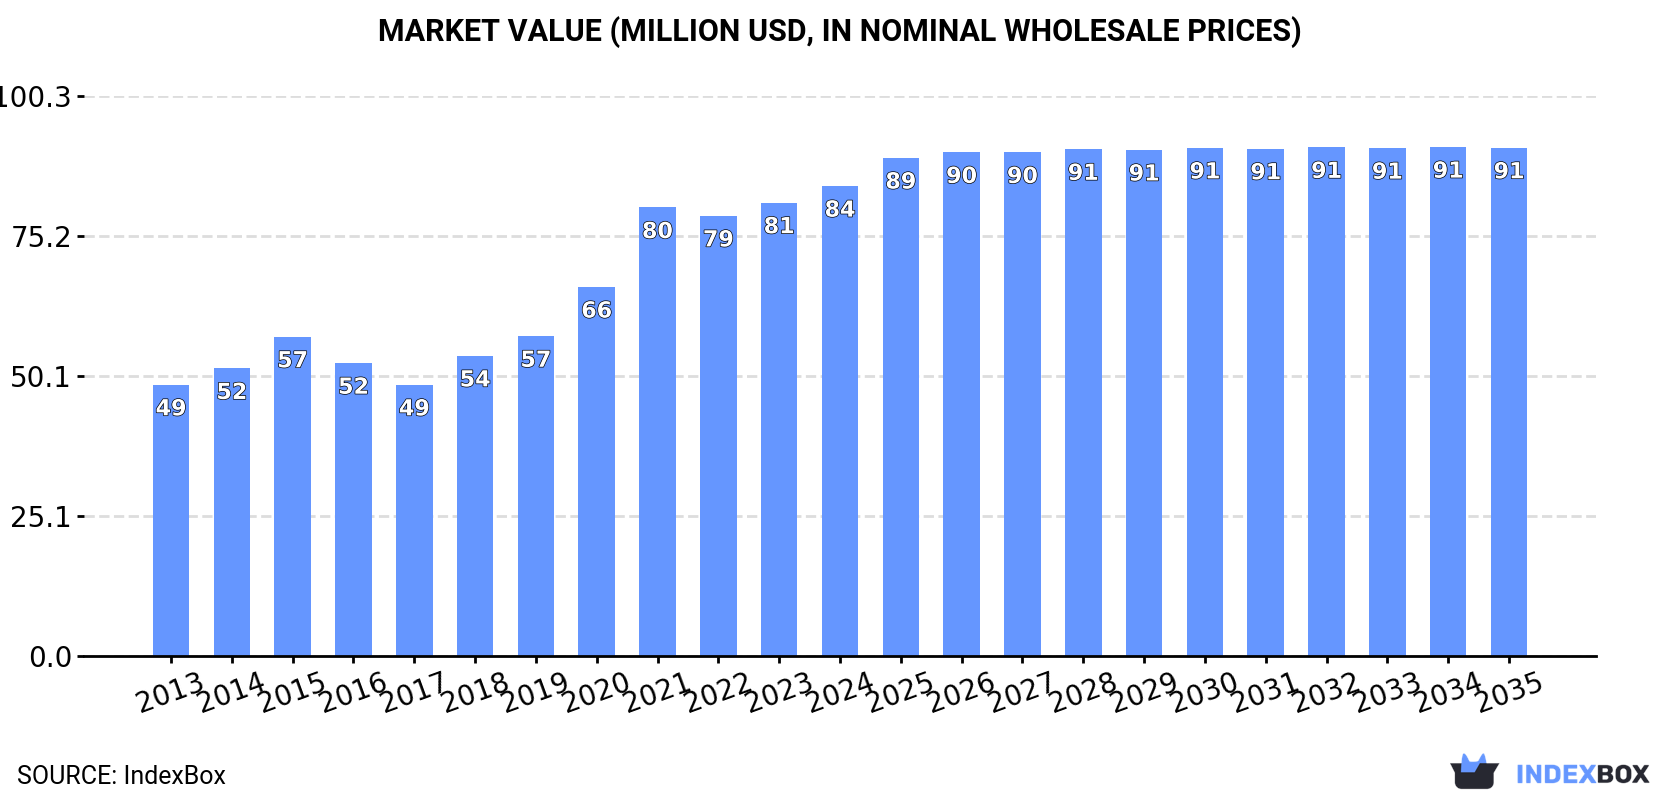
Driven by the demand for fluorides, fluorosilicates, fluoroaluminates, and other complex fluorine salts, the UK market is forecasted to experience continuous growth. By 2035, the market volume is expected to reach 51K tons and the market value is projected to reach $91M. The market is anticipated to expand with a CAGR of +0.7% for both volume and value from 2024 to 2035.
Market Forecast
Driven by increasing demand for fluorides, fluorosilicates, fluoroaluminates and other complex fluorine salts in the UK, the market is expected to continue an upward consumption trend over the next decade. Market performance is forecast to decelerate, expanding with an anticipated CAGR of +0.7% for the period from 2024 to 2035, which is projected to bring the market volume to 51K tons by the end of 2035.
In value terms, the market is forecast to increase with an anticipated CAGR of +0.7% for the period from 2024 to 2035, which is projected to bring the market value to $91M (in nominal wholesale prices) by the end of 2035.
 ConsumptionUnited Kingdom’s Consumption of Fluorides, Fluorosilicates, Fluoroaluminates And Other Complex Fluorine Salts
After three years of growth, consumption of fluorides, fluorosilicates, fluoroaluminates and other complex fluorine salts decreased by -5% to 48K tons in 2024. The total consumption volume increased at an average annual rate of +2.3% from 2013 to 2024; the trend pattern remained consistent, with somewhat noticeable fluctuations throughout the analyzed period. Complex fluorine salts consumption peaked at 50K tons in 2023, and then fell in the following year.
The size of the complex fluorine salts market in the UK amounted to $84M in 2024, growing by 3.7% against the previous year. This figure reflects the total revenues of producers and importers (excluding logistics costs, retail marketing costs, and retailers’ margins, which will be included in the final consumer price). In general, the total consumption indicated resilient growth from 2013 to 2024: its value increased at an average annual rate of +5.1% over the last eleven-year period. The trend pattern, however, indicated some noticeable fluctuations being recorded throughout the analyzed period. Based on 2024 figures, consumption increased by +73.3% against 2017 indices. Complex fluorine salts consumption peaked in 2024 and is likely to see gradual growth in the immediate term.
ProductionUnited Kingdom’s Production of Fluorides, Fluorosilicates, Fluoroaluminates And Other Complex Fluorine Salts
In 2024, after three years of growth, there was significant decline in production of fluorides, fluorosilicates, fluoroaluminates and other complex fluorine salts, when its volume decreased by -5.1% to 45K tons. The total output volume increased at an average annual rate of +2.0% from 2013 to 2024; the trend pattern remained consistent, with somewhat noticeable fluctuations being recorded throughout the analyzed period. The most prominent rate of growth was recorded in 2023 with an increase of 13%. As a result, production attained the peak volume of 48K tons, and then declined in the following year.
In value terms, complex fluorine salts production reached $81M in 2024 estimated in export price. Over the period under review, the total production indicated a strong increase from 2013 to 2024: its value increased at an average annual rate of +5.3% over the last eleven-year period. The trend pattern, however, indicated some noticeable fluctuations being recorded throughout the analyzed period. Based on 2024 figures, production increased by +88.4% against 2017 indices. The most prominent rate of growth was recorded in 2021 when the production volume increased by 20% against the previous year. Complex fluorine salts production peaked in 2024 and is likely to see steady growth in years to come.
ImportsUnited Kingdom’s Imports of Fluorides, Fluorosilicates, Fluoroaluminates And Other Complex Fluorine Salts
In 2024, the amount of fluorides, fluorosilicates, fluoroaluminates and other complex fluorine salts imported into the UK shrank modestly to 4.1K tons, dropping by -1.6% against 2023. Over the period under review, imports saw a perceptible curtailment. The growth pace was the most rapid in 2016 with an increase of 29% against the previous year. Imports peaked at 7K tons in 2014; however, from 2015 to 2024, imports stood at a somewhat lower figure.
In value terms, complex fluorine salts imports declined rapidly to $18M in 2024. In general, imports, however, continue to indicate a perceptible expansion. The growth pace was the most rapid in 2021 when imports increased by 70%. As a result, imports reached the peak of $49M. From 2022 to 2024, the growth of imports remained at a lower figure.
Imports By Country
In 2024, China (1.7K tons) constituted the largest complex fluorine salts supplier to the UK, with a 41% share of total imports. Moreover, complex fluorine salts imports from China exceeded the figures recorded by the second-largest supplier, Germany (628 tons), threefold. The third position in this ranking was taken by Denmark (428 tons), with a 10% share.
From 2013 to 2024, the average annual rate of growth in terms of volume from China totaled -5.4%. The remaining supplying countries recorded the following average annual rates of imports growth: Germany (+3.9% per year) and Denmark (+59.5% per year).
In value terms, China ($8.2M) constituted the largest supplier of fluorides, fluorosilicates, fluoroaluminates and other complex fluorine salts to the UK, comprising 45% of total imports. The second position in the ranking was held by Germany ($2.8M), with a 15% share of total imports. It was followed by Japan, with a 6.6% share.
From 2013 to 2024, the average annual rate of growth in terms of value from China stood at +3.8%. The remaining supplying countries recorded the following average annual rates of imports growth: Germany (+5.1% per year) and Japan (-3.3% per year).
Import Prices By Country
In 2024, the average complex fluorine salts import price amounted to $4,455 per ton, with a decrease of -38.5% against the previous year. Overall, the import price, however, enjoyed prominent growth. The most prominent rate of growth was recorded in 2017 an increase of 51% against the previous year. Over the period under review, average import prices hit record highs at $7,655 per ton in 2022; however, from 2023 to 2024, import prices remained at a lower figure.
There were significant differences in the average prices amongst the major supplying countries. In 2024, amid the top importers, the country with the highest price was Japan ($16,275 per ton), while the price for Denmark ($580 per ton) was amongst the lowest.
From 2013 to 2024, the most notable rate of growth in terms of prices was attained by China (+9.8%), while the prices for the other major suppliers experienced more modest paces of growth.
ExportsUnited Kingdom’s Exports of Fluorides, Fluorosilicates, Fluoroaluminates And Other Complex Fluorine Salts
After five years of decline, overseas shipments of fluorides, fluorosilicates, fluoroaluminates and other complex fluorine salts increased by 1.2% to 1.8K tons in 2024. Overall, exports, however, recorded a abrupt setback. The most prominent rate of growth was recorded in 2018 when exports increased by 12% against the previous year. Over the period under review, the exports hit record highs at 6.3K tons in 2014; however, from 2015 to 2024, the exports stood at a somewhat lower figure.
In value terms, complex fluorine salts exports rose sharply to $3.2M in 2024. Over the period under review, exports, however, saw a abrupt descent. The pace of growth appeared the most rapid in 2018 when exports increased by 22% against the previous year. The exports peaked at $6.9M in 2014; however, from 2015 to 2024, the exports failed to regain momentum.
Exports By Country
Italy (834 tons) was the main destination for complex fluorine salts exports from the UK, with a 47% share of total exports. Moreover, complex fluorine salts exports to Italy exceeded the volume sent to the second major destination, the Netherlands (365 tons), twofold. The third position in this ranking was taken by Germany (281 tons), with a 16% share.
From 2013 to 2024, the average annual growth rate of volume to Italy stood at -8.2%. Exports to the other major destinations recorded the following average annual rates of exports growth: the Netherlands (-1.8% per year) and Germany (-4.6% per year).
In value terms, the largest markets for complex fluorine salts exported from the UK were Germany ($858K), Italy ($724K) and the Netherlands ($388K), with a combined 61% share of total exports. China, France, Israel, Spain, the United States and Poland lagged somewhat behind, together accounting for a further 20%.
China, with a CAGR of +8.9%, recorded the highest growth rate of the value of exports, in terms of the main countries of destination over the period under review, while shipments for the other leaders experienced more modest paces of growth.
Export Prices By Country
The average complex fluorine salts export price stood at $1,840 per ton in 2024, increasing by 13% against the previous year. In general, export price indicated a measured expansion from 2013 to 2024: its price increased at an average annual rate of +4.0% over the last eleven years. The trend pattern, however, indicated some noticeable fluctuations being recorded throughout the analyzed period. The most prominent rate of growth was recorded in 2020 an increase of 28% against the previous year. The export price peaked at $1,956 per ton in 2021; however, from 2022 to 2024, the export prices remained at a lower figure.
Prices varied noticeably by country of destination: amid the top suppliers, the country with the highest price was the United States ($30,727 per ton), while the average price for exports to Spain ($697 per ton) was amongst the lowest.
From 2013 to 2024, the most notable rate of growth in terms of prices was recorded for supplies to the United States (+29.3%), while the prices for the other major destinations experienced more modest paces of growth.