A bullish crossover between the stock’s 5-day and 20-day moving averages has probably taken place, the analyst said.
Adani Energy Solutions has seen a breakout on the technical charts after a prolonged period of downtrend. The stock had shed nearly 12% of its value over the past year.
According to SEBI-registered analyst Anupam Bajpai, the stock began showing signs of a technical reversal in mid-June. After closing below its 200-day moving average on June 17, the stock price found support at its 100-day moving average a couple of sessions later.
Bajpai noted a clear shift in momentum on June 23 when the stock gained 1.1% and closed back above the 100-day moving average, indicating renewed buying interest.
The bullish sentiment strengthened on June 26 after the stock decisively closed above its key resistance at the 200-day moving average. The rally continued on June 27, with the shares closing 2.2% higher.
At the time of writing, Adani Energy shares were trading at ₹879.15.
He stated that the stock’s next resistance level lies near ₹915, provided the positive momentum persists. A bullish crossover between the 5-day and 20-day moving averages (MACD) is either imminent or already in place, reinforcing the short- to medium-term upside potential.
Looking ahead, the 200-day moving average will serve as a critical support. As long as the stock holds above this level, the outlook remains positive, with potential to climb toward ₹915, Bajpai concluded.
Last month, the transmission systems operator reported strong Q4 results, with profits and revenue surging 78% and 35%, respectively. According to reports, the company is in talks to buy the transmission assets of Hyderabad-based Megha Engineering & Infrastructures.
Retail sentiment on Stocktwits remained ‘bearish’ for this counter.
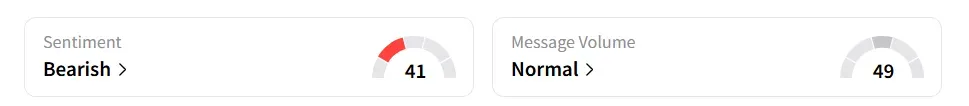 ADANIENSOL’s Sentiment Meter And Message Volumes At 12:29 p.m. On June 30 | Source: Stocktwits
Year-to-date (YTD), the shares have risen over 9%.
For updates and corrections, email newsroom[at]stocktwits[dot]com.