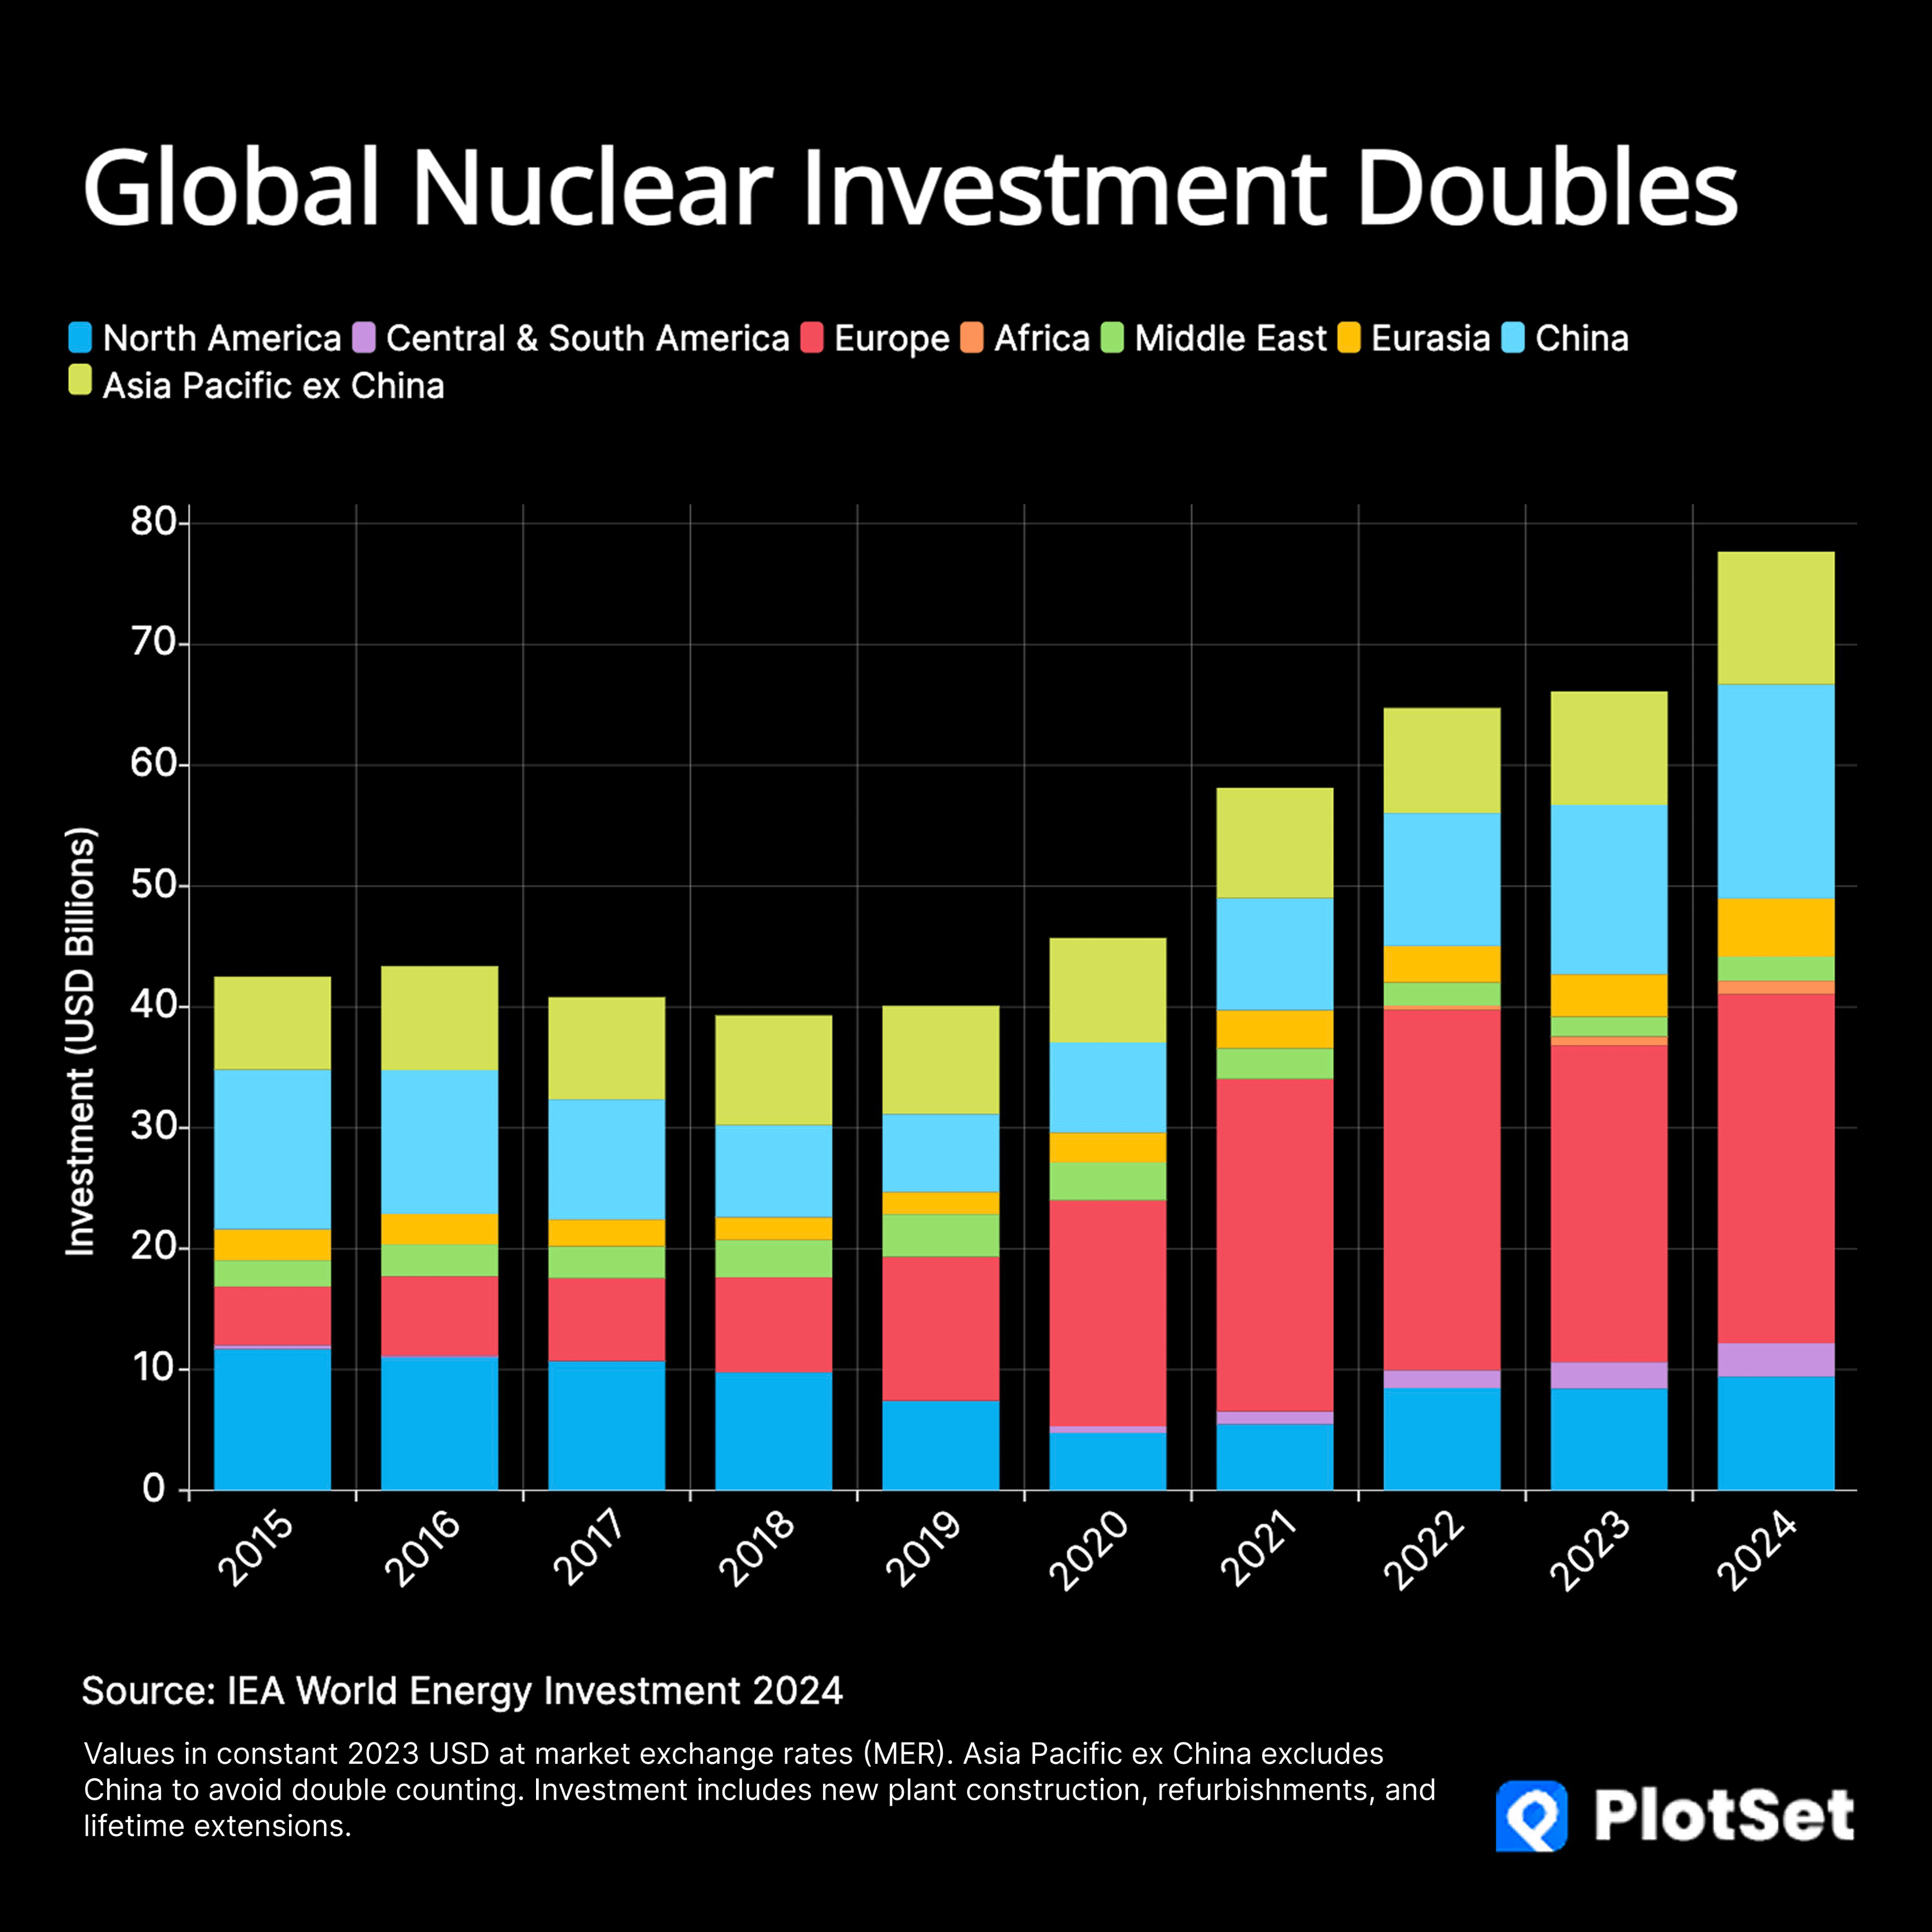
I used python to build the data set for this chart after downloading the 2024 data file for the IEA World Energy Investment 2024 report. I then use PlotSet to build and interactive data visualisation of the level of investment in Nuclear Energy, split by regions so that I could see the story behind the data. This is a snapshot of the chart. When you run your mouse over the version I created in PlotSet, you can explore the underlying data.
Lemme guess vast majority of europe is france keeping their fleet up?
Yeah, but that’s just the Hinkley C build cost overruns!
/s
but Hinkley C – it was meant to cost £18bn in 2015 but is now looking at £35bn (in 2015 prices), or £46bn not trying to account for inflation when it’s done in 10 years time.
I know there are similar stories elsewhere and it does make me wonder how much of this growth is actually overspends on new builds already planned/in construction in 2015 and how much of it is actually more plants being built- I realise this includes refurbs and extensions as well as new builds.
According to the source, it was projected that 500 B USD alone went into photovoltaic technologies in 2024.
All your chart is saying is that nuclear is still way too expensive 😛
So since 2015, Europe has:
* Invested 146 billion USD in nuclear energy
* Commissioned 2 new nuclear reactors (~2GW total: Olkilouoto 3 and Mochovce 3)
* Begun constructing 3 new reactors (~5GW total: Flamanville 3 and Hinkley C-1 and C-2,)
* Shut down 23 reactors (~20GW total across Germany, France, UK, Sweden, Spain and Switzerland)
* Reduced nuclear generation by about 20%
Imagine where we could be if we’d done this 30 years ago. Might not even need fossil fuels
How much of that is Iran? And they have to rebuild all that now.
![[OC] Global Nuclear Investment Over Time](https://www.europesays.com/wp-content/uploads/2025/07/sy38z47x38af1-1920x1024.png)
9 comments
I used python to build the data set for this chart after downloading the 2024 data file for the IEA World Energy Investment 2024 report. I then use PlotSet to build and interactive data visualisation of the level of investment in Nuclear Energy, split by regions so that I could see the story behind the data. This is a snapshot of the chart. When you run your mouse over the version I created in PlotSet, you can explore the underlying data.
Lemme guess vast majority of europe is france keeping their fleet up?
Yeah, but that’s just the Hinkley C build cost overruns!
/s
but Hinkley C – it was meant to cost £18bn in 2015 but is now looking at £35bn (in 2015 prices), or £46bn not trying to account for inflation when it’s done in 10 years time.
I know there are similar stories elsewhere and it does make me wonder how much of this growth is actually overspends on new builds already planned/in construction in 2015 and how much of it is actually more plants being built- I realise this includes refurbs and extensions as well as new builds.
For scale: unaccounted for [650B€ for grid update alone](https://www.cleanenergywire.org/news/electricity-grid-upgrades-will-cost-germany-650-billion-euros-2045-report#), on top of [520B€](https://www.cleanenergywire.org/factsheets/how-much-does-germanys-energy-transition-cost).
(not counting the [neighbors](https://old.reddit.com/r/engineering/comments/8in5ip/too_much_of_a_good_thing_an_illustrated_guide_to/dyttjfk/?utm_source=reddit&utm_medium=usertext&utm_name=nuclear&utm_content=t1_mxq58pu)).
Or [250B€](https://cdn.futura-sciences.com/cdn-cgi/image/width=830,quality=60,format=auto/sources/images/actu/rte/36447_WEB-NUCLEAIRE-COUR-COMPTES-01.jpg)
Would be interesting to plot the investment vs the installed capacity. China and Russia are getting much more bang for their bucks.
For a rough picture of what has been happening since [last year](https://old.reddit.com/r/nuclear/wiki/2024).
Do investments actually go up or is nuclear energy just going up in price because of inflation etc?
The more important graph.
https://preview.redd.it/7yx8pdfep8af1.png?width=1387&format=png&auto=webp&s=01dd0523a5ee7bab19a73bc7a2d4c319bc64be66
Nuclear is just a (small) part of the yellow box.
According to the source, it was projected that 500 B USD alone went into photovoltaic technologies in 2024.
All your chart is saying is that nuclear is still way too expensive 😛
So since 2015, Europe has:
* Invested 146 billion USD in nuclear energy
* Commissioned 2 new nuclear reactors (~2GW total: Olkilouoto 3 and Mochovce 3)
* Begun constructing 3 new reactors (~5GW total: Flamanville 3 and Hinkley C-1 and C-2,)
* Shut down 23 reactors (~20GW total across Germany, France, UK, Sweden, Spain and Switzerland)
* Reduced nuclear generation by about 20%
Imagine where we could be if we’d done this 30 years ago. Might not even need fossil fuels
How much of that is Iran? And they have to rebuild all that now.
Comments are closed.