Using the ordered cluster analysis method to analyze the NDVI data of the source region of the Yellow River, the corresponding Sn(τ) for τ was calculated, and the NDVI change curve was plotted, as shown in the figure below (Fig. 3). From the figure, it can be observed that 2009 serves as the change point. The ordered cluster test value |T|=5.82 > T (0.05/2) = 1.64, indicating that there was a significant jump in the mean values before and after 2009. Using 2009 as the dividing point, the NDVI data for the source region of the Yellow River were divided into two periods: 1982–2009 and 2010–2020.
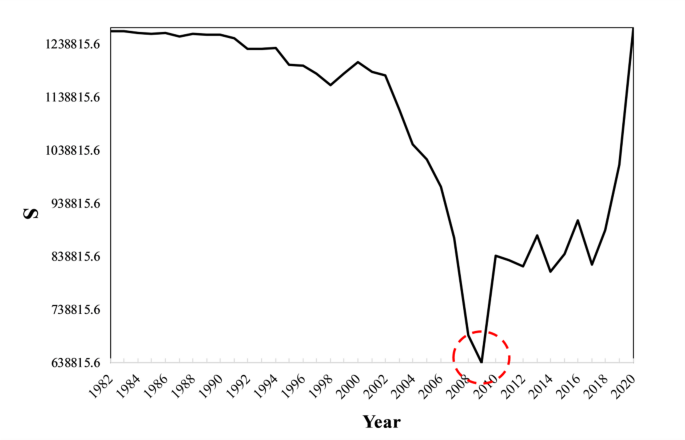
NDVI ordered cluster mutation analysis.
Characteristics of temporal changes in vegetation cover
Utilizing the Maximum Value Composite (MVC) method, the annual NDVI data for the source region of the Yellow River were derived by selecting the maximum NDVI values from May to September for each year between 1982 and 202011. The resulting NDVI change curve, as depicted in the Fig. 4, illustrates a significant increase from 0.63 in 1982 to 0.68 in 2020, indicating a notable enhancement in vegetation cover over this period. An abrupt change in NDVI occurred in 2009, allowing the division of the data into two distinct periods: Stage 1 (1982–2009): The NDVI decreased from 0.63 to 0.62, exhibiting a gradual decline at a rate of −0.56 per year; Stage 2 (2010–2020): Following 2009, the NDVI increased from 0.62 to 0.68 by 2020, demonstrating a clear upward trend at a rate of 17.77 per year.
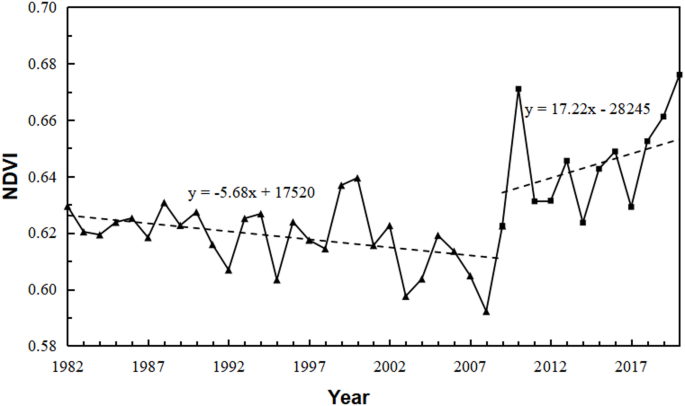
Trend of NDVI changes in the source region of the Yellow River in May-September months of each year from 1982 to 2020.
Characteristics of spatial changes in vegetation cover
In order to better evaluate the spatial cover changes of vegetation in the area, the NDVI was partitioned with reference to the classification methods of existing studies14 and generally divided into bare areas (−0.3 to 0], low-coverage areas (0 to 0.2], medium-low-coverage areas (0.2 to 0.4], medium-coverage areas (0.4 to 0.6], medium-high-coverage areas (0.6 to 0.8], and high coverage areas (0.8 to 1].
As depicted in Fig. 5, the vegetation cover in the source region of the Yellow River exhibits distinct regional variations, with generally lower coverage in the northwest and higher coverage in the southeast. In the northwestern region, encompassing Eling Lake, Zaling Lake, and the northern part of Longyangxia Reservoir, vegetation cover is sparse, resulting in lower NDVI values predominantly within the low or medium-low coverage categories. Conversely, areas such as Eling Lake, southern Zaling Lake, the northern and northeastern Bayan Kara Mountains, and the southern part of Longyangxia Reservoir exhibit better vegetation cover, with NDVI values primarily in the medium and medium-high coverage ranges. Similarly, the Ruoergai Basin and the southeastern part of the Amne Machin Mountains, among other regions, display high vegetation cover, with NDVI values predominantly in the medium and high coverage categories. In the central part of the study area, NDVI values range between 0.4 and 0.8, indicating medium to medium-high coverage. These spatial patterns align closely with the area’s altitude and climatic conditions15.
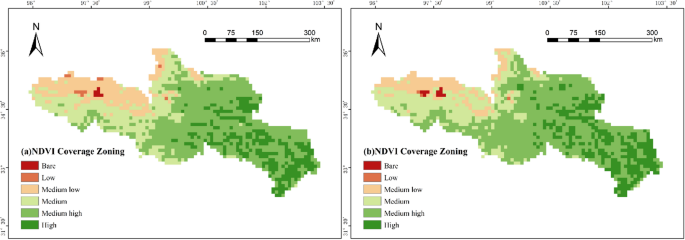
Annual average May-September NDVI coverage zones in the source region of the Yellow River (a. 1982–2009 years, b. 2010–2020 years) (Cartographic software: ArcGIS 10.6, https://desktop.arcgis.com/).
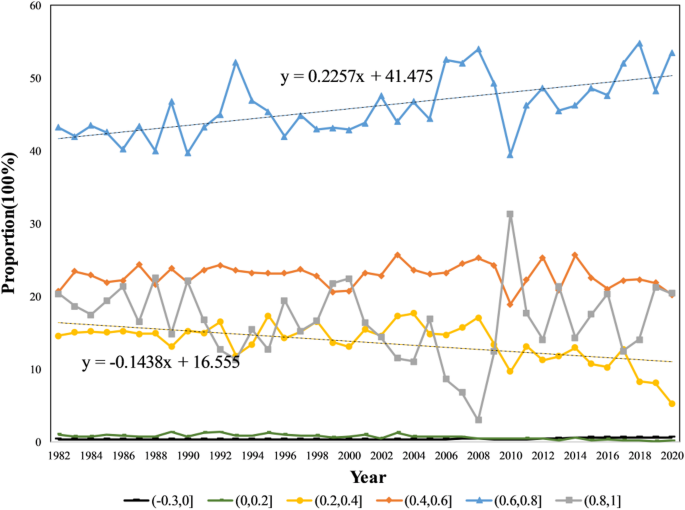
Changes in the proportion of NDVI coverage zones by year within the source region of the Yellow River.
As illustrated in Fig. 6, between 1982 and 2020, the study area exhibited relatively low proportions of exposed and low-coverage regions, with minimal significant change over time. The proportion of medium-low coverage areas decreased at a rate of − 0.1438 per year. The proportion of medium-coverage areas remained relatively stable, showing no significant change. Conversely, the proportion of medium-high coverage areas increased at a rate of 0.2257 per year, indicating notable growth in this category. The proportion of high-coverage areas fluctuated significantly, particularly around 2009: it continuously decreased before 2009, then began to rise in a fluctuating manner after 2009. Overall, since 2009, the ecological condition of vegetation in the region has been improving, with vegetation coverage gradually increasing.
Trend analysis of vegetation cover changes
Utilizing one-dimensional linear regression analysis, the trends in vegetation cover change within the study area were examined. Figure 7 illustrates the vegetation restoration patterns during two periods: 1982–2009 and 2010–2020. Between 1982 and 2009, significant increases in NDVI were observed in the central and northern regions of the source region of the Yellow River, while vegetation coverage in most southern regions remained relatively stable. In contrast, between 2010 and 2020, the western and northern parts of the Yellow River source area showed a large-scale improvement trend. Notable vegetation enhancements were primarily concentrated in well-executed ecological restoration projects within western and northern nature reserves, such as the Eling Lake-Zhaling Lake Nature Reserve and the Zhongtie-Jungong Nature Reserve, as well as in ecological restoration pilot areas like the southwest of Dari County15. Conversely, regions with significant NDVI decreases were mainly located south of Zhaling Lake and Eling Lake, including areas such as Chengduo, Gande, Dari, and Jiuzhi in the southeastern part of the source area, which have also experienced vegetation degradation16. Overall, the vegetation cover change trend in the region demonstrates significant spatial variation. Vegetation recovery is characterized by a notable increase, with the coverage area rising from 10.15% during 1982–2009 to 55.16% in 2010–2020, marking a growth of 45.01%. Simultaneously, the proportion of lightly degraded and stable areas significantly decreased, from 24.73% to 34.06% in 1982–2009 to 7.84% and 7.78% in 2010–2020, respectively. In terms of the Slope index, the average value for 1982–2009 was − 0.000568, while it jumped to 0.001827 in 2010–2020, indicating a more evident trend of vegetation recovery.
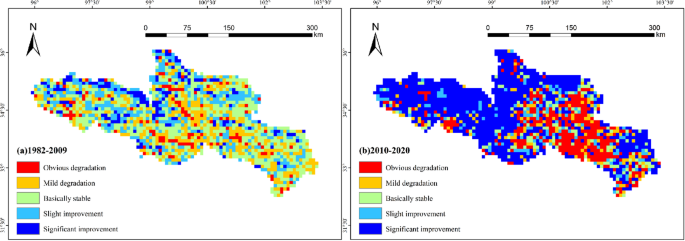
Vegetation cover change characteristics in the source region of the Yellow River from 1982 to 2020 based on Slope trend analysis (a. 1982–2009 years, b. 2010–2020 years) (Cartographic software: ArcGIS 10.6, https://desktop.arcgis.com/).
Impact of meteorological factors on vegetation cover
As shown in Fig. 8, the average annual precipitation in the study area gradually increases from northwest to southeast, exhibiting distinct spatial differences. Between 1982 and 2009, the average annual precipitation in the upper part of the region, along Lake Eling and the Yellow River, ranged from 484 to 642 mm, while the southeastern part of the region, including Hongyuan, Ruoergai, Maqu, and Jiuzhi, received higher precipitation, with values ranging from 849 to 1146 mm. From 2010 to 2020, the average annual precipitation in the upper part of the region increased slightly, ranging from 484 to 693 mm, while it continued to rise toward the southeast, reaching 901 to 1146 mm. The mean annual temperature exhibits a clear increasing trend from west to east, with the eastern side of the source region of the Yellow River experiencing significantly higher temperatures than the western side. Between 1982 and 2020, the average annual temperatures in Tangnaihe, Maqu, and Hongyuan in the eastern part of the region ranged from − 2.36 °C to 4.19 °C, while those in Maduo, located in the western and north-central parts, ranged from − 8.87 °C to −6.17 °C. During the same period, regions with higher soil moisture were mainly concentrated in the west-central part and the southeastern Yellow River source area, including the Ruoergai Mound Plateau, the Gololok Yushu Plateau Wide Valley, and the Huangnan Mountains, where soil moisture content ranged from 0.60 to 0.68 m³/m³. Soil temperature exhibited significant spatial variation, decreasing from 2.93 °C to 5.66 °C in the Hongyuan region in the southeast to −6.42 °C to −3.41 °C in the Maduo region in the northwest. Furthermore, actual evapotranspiration in the region decreased from 517 to 633 mm/year in the east to 232 to 335 mm/year in the west.
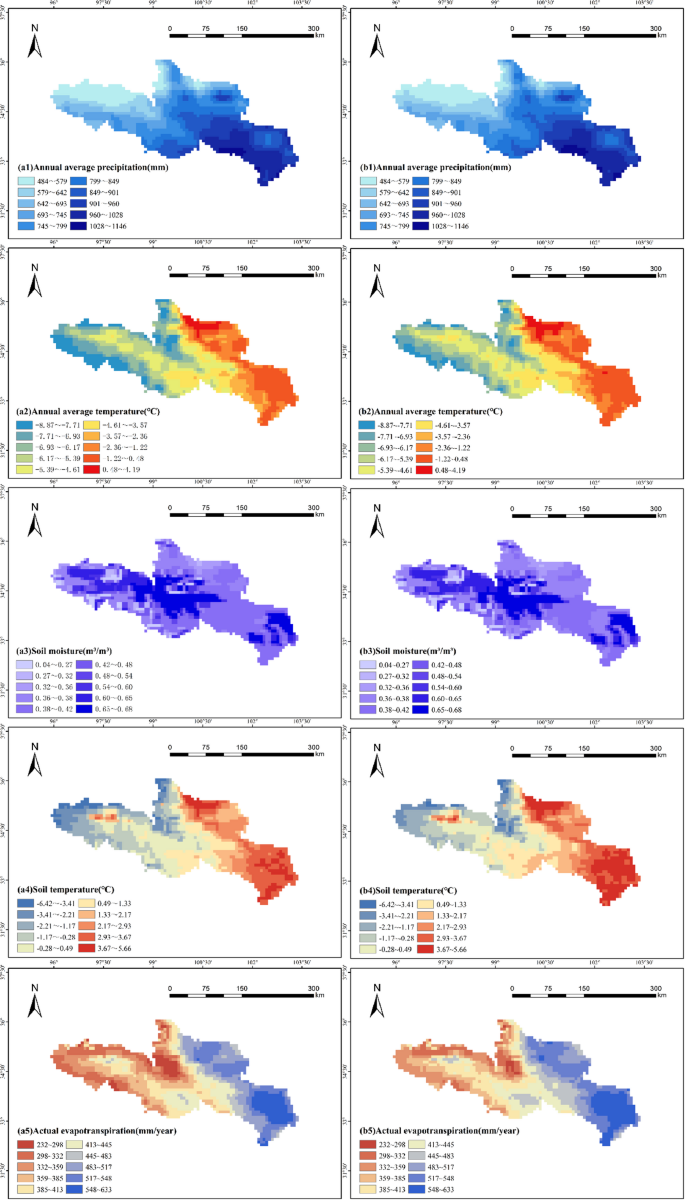
Spatial distribution of precipitation, temperature, soil moisture, soil temperature, and actual evapotranspiration in the source region of the Yellow River during 1982–2020 (a. 1982–2009 years, b. 2010–2020 years) (Cartographic software: ArcGIS 10.6, https://desktop.arcgis.com/).
According to the data in Fig. 9, the correlation between precipitation and NDVI in most regions during the period from 1982 to 2009 ranged from − 1 to 0.2, indicating a low correlation. In contrast, during the period from 2010 to 2020, the positive correlation coefficient between precipitation and NDVI in the source region of the Yellow River increased significantly, accounting for 72.64% of the region. The northern part of the source region of the Yellow River belongs to an arid climate zone and is adjacent to the Qaidam Basin, where water resources are scarce, temperatures are high, and the water content in the soil is insufficient. Precipitation in this region plays a critical role in promoting vegetation growth, which explains the stronger influence of precipitation on vegetation NDVI in the northern part of the source area13 resulting in a marked increase in the correlation between precipitation and NDVI during the period from 2010 to 2020. During 1982–2009, the correlation between temperature and NDVI was weak in most regions, with correlation coefficients mostly ranging from − 1 to 0.2. However, in 2010–2020, the correlation between temperature and NDVI improved significantly, and the correlation coefficients were positive in most regions, with values ranging from 0.2 to 1, and the positive correlation coefficients accounted for as high as 90.51%, indicating a significant increase in the correlation between temperature and NDVI.
For soil moisture, the correlation with NDVI between 1982 and 2009 was low, with little change between the two periods. Similarly, the correlation between soil temperature and NDVI was weak in 1982–2009, with most correlation coefficients ranging from − 1 to 0.2, and only 45.6% of regions showing a positive correlation. However, during the period from 2010 to 2020, the correlation between soil temperature and NDVI improved markedly, with correlation coefficients ranging from 0.2 to 1 in most areas, and 76.56% of regions showing a positive correlation.
Regarding actual evapotranspiration, the correlation with NDVI was poor during 1982–2009, with a negative correlation coefficient of 70.62%; However, during the period from 2010 to 2020, the correlation improved significantly, with 70.56% of regions showing a positive correlation, particularly in the southeastern and central areas.
In summary, the correlation between NDVI and precipitation, temperature, soil temperature, and actual evapotranspiration significantly improved during the period from 2010 to 2020. The proportion of positive correlations increased sharply. This indicates that the climate of the source region of the Yellow River shows a warming and humidifying trend with the increase of temperature and cumulative temperature, and the correlation between vegetation and meteorological factors is deepening.
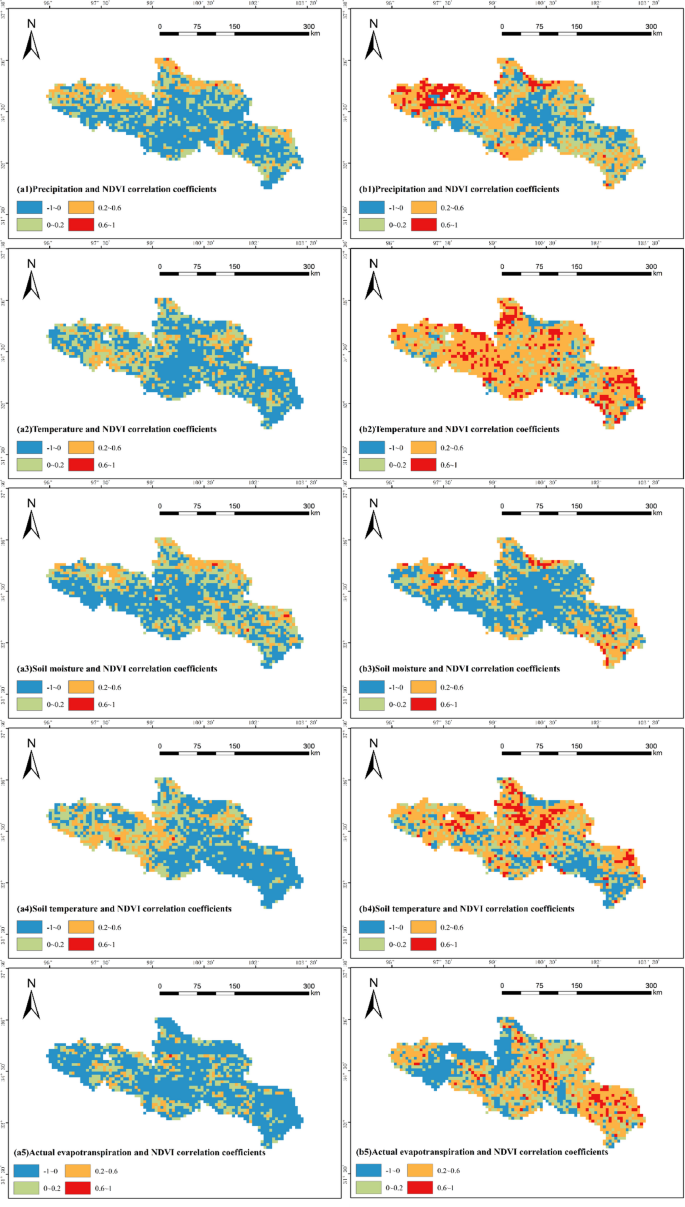
Spatial distribution of correlation coefficients between NDVI and precipitation, temperature, soil moisture, soil temperature, and actual evapotranspiration in the source region of the Yellow River from 1982 to 2020(a. 1982–2009 years, b. 2010–2020 years) (Cartographic software: ArcGIS 10.6, https://desktop.arcgis.com/).
To explore the degree of influence of each driver and the interaction of natural factors on vegetation cover, the weights (q-values) of the individual factors were first analyzed to identify the dominant drivers. These factors included a range of data, such as precipitation, temperature, soil moisture, soil temperature, actual evapotranspiration, land-use type, GDP, and population density.
Based on the Geodetector method, the q-values of each driving factor in the region were calculated and analyzed (see Fig. 10). The results showed that the influence of each driving factor on regional NDVI during the period 1982–2009 was ranked as follows: precipitation (0.76) > soil temperature (0.55) > temperature (0.53) > actual evapotranspiration (0.51) > soil moisture (0.26) > elevation (0.18) > population density (0.05) > slope (0.02) > land-use type (0.02) > slope aspect (0.01) > GDP (0.00). And during 2010–2020, the order of influence of each driver on NDVI was: precipitation (0.74) > actual evapotranspiration (0.58) > temperature (0.52) > soil temperature (0.52) > soil moisture (0.22) > elevation (0.18) > population density (0.05) > GDP (0.04) > land-use type (0.02) > slope (0.02) > slope aspect (0.00).
It is evident that meteorological factors play a more significant role in the regional NDVI spatial differentiation. Precipitation, temperature, soil temperature, and actual evapotranspiration showed strong contributions in both time periods, with values exceeding 0.5, while natural factors such as elevation and slope, and human factors such as population density and GDP had relatively smaller contributions to NDVI. Therefore, meteorological factors are the primary drivers influencing the spatial differentiation of NDVI in the region. In both 1982–2009 and 2010–2020, precipitation remained the dominant factor influencing vegetation cover, which is closely tied to the typical arid and semi-arid climate of the source region of the Yellow River. Precipitation serves as the primary limiting factor for vegetation growth in this area.
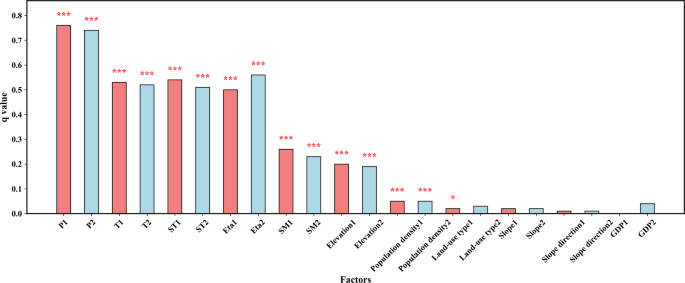
NDVI driving factor q values of vegetation in the source region of the Yellow River from 1982 to 2020 (p p p
In order to focus on the variation of vegetation cover under the interaction of natural factors, the Geodetector method was used to analyze the interactions between different driving factors and their impact on the spatial differentiation of NDVI (see Fig. 11). Based on the data in Fig. 11, the following conclusions can be drawn: (1) The interaction of any two driving factors has a greater effect on NDVI than the independent effect of a single factor, showing a two-factor enhancement effect. (2) The q-values of the interaction combinations of precipitation and the rest of the driving factors are all greater than 0.7, and the q-values of the interaction combinations of temperature and the rest of the driving factors are all greater than 0.5. (3) As a whole, the changes of the regional NDVI values were significantly affected by meteorological factors such as precipitation and temperature, and the interaction combination of the driving factors had a significantly higher driving force on NDVI than that of a single factor.
Overall, the interaction of natural factors, such as precipitation and temperature, plays a crucial role in the variation of NDVI values in the region, and its effect is significantly stronger than that of meteorological or natural factors in isolation. This “enhancement effect” suggests that the factors within the ecosystem are not merely additive but are interdependent and mutually reinforcing. Climatic factors were the primary drivers in the study area, and their interactions were more complex, directly influencing the spatial distribution of NDVI.
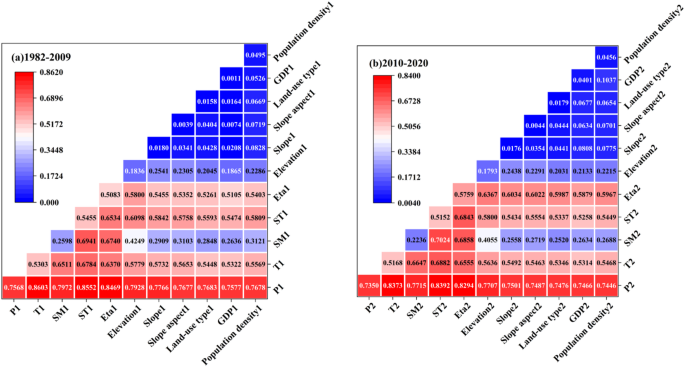
Interactive combination driving force value of NDVI driving factors in the source region of the Yellow River from 1982 to 2020 (q).