
This section explores the effect on IFT using two anionic surfactants, SDS and SDBS, and two cationic surfactants, such as CTAB and DTAB. Since the surfactant molecules adsorb at the interface between two immiscible phases, the first result of an action can be observed as a rapid reduction in IFT, and this phenomenon is a function of concentration. IFT falls with concentration until monolayer coverage is reached, after which further surfactant has little impact. The corresponding surfactant concentration is known as the critical micelle concentration (CMC). Once the CMC value of a surfactant was reached, any additional surfactant added only changed the shape and size of the micelles. This may slightly decrease the effective concentration of surfactant due to the solubilisation of the micelles in the aqueous phase, and the reduction of surfactant molecules at the interface may marginally reduce the IFT value.
Figure 2 shows the variation of IFT with the concentration for different surfactants, SDS, SDBS, CTAB, and DTAB. An increase in concentration significantly reduced IFT for both anionic and cationic surfactants. However, the extent of IFT reduction is different for each surfactant.
The minimum IFT for anionic surfactants (SDS: 5.3 mN/m at 2500 ppm; SDBS: 4.9 mN/m at 1500 ppm) and for cationic surfactants (CTAB: 2.0 mN/m at 500 ppm; DTAB: 4.3 mN/m at 4700 ppm) was observed at their respective CMC values. This parameter is crucial for understanding how the surfactant behaves in a solution. Going beyond this concentration only results in unnecessary expenses, increasing the overall cost of the process. To effectively break oil droplets and enhance oil recovery, it is essential to maintain a low IFT throughout the process. Figure 3a-d shows the sequence of images of the solution drops at different concentrations of SDS, SDBS, CTAB, and DTAB surfactants, respectively.

IFT between sunflower oil and aqueous phase solutions at different surfactant concentrations at 25 ± 2 °C (a) SDS, (b) SDBS, (c) CTAB, and (d) DTAB.

Sequence of the image of drops at different surfactant concentrations: (a) SDS, (b) SDBS, (c) CTAB, and (d) DTAB.
Effect of salt on interfacial tension
An aqueous solution containing surfactant experiences a further reduction of IFT when salt is added to the solution. This phenomenon is caused by electrostatic repulsion between the charged head groups of surfactants at the interface35,36. Also, adding salt speeds up the movement of surfactants towards the interface36. Figure 4a–e shows the sequence of images captured of droplets to estimate the IFT with different salt concentrations and SDS, SDBS, CTAB and DTAB, respectively, at their CMC. Figure 4f shows a reduction in IFT with increased salt concentration. Here, the surfactant concentration is maintained equal to its respective CMC value. In the absence of surfactant, a slight reduction in IFT can be observed from 27 ± 1 mN/m to 20 ± 1 mN/m with the addition of salt from 0 to 5 wt% as shown in Fig. 4g. In the case of SDS, SDBS, and CTAB, IFT declined significantly even at 1 wt% of salt and further addition of salt has a marginal reduction. Whereas in the case of DTAB, the IFT declined linearly with salt concentration. In Fig. 4f, 0 wt% salt concentration indicates the IFT value for 2500 ppm SDS, 1500 ppm SDBS, 500 ppm CTAB, and 4700 ppm DTAB, respectively. In addition to NaCl, the IFT values reduce up to 0.32 mN/m, 0.3 mN/m, 0.42 mN/m, and 0.33 mN/m at 3 wt%, 2 wt%, 1 wt% and 3 wt% salt concentration (optimum salinity) for SDS, SDBS, CTAB, and DTAB surfactants, respectively. The optimum salinity for a given surfactant is defined as the NaCl concentration at which the lowest IFT is attained.

Sequence of the image of drops at different salt concentrations with (a) SDS at 2500 ppm, (b) SDBS at 1500 ppm, (c) CTAB at 500 ppm, (d) DTAB at 4700 ppm, (e) Surfactant at 0 ppm (f) IFT between the sunflower oil and an aqueous solution of surfactant at their respective CMC with varying salt (NaCl) concentrations, and (g) IFT between sunflower oil and an aqueous solution of different salt (NaCl) concentrations.
Effect of polymer on interfacial tension
The effect of polymer addition on IFT, both with and without surfactant, was investigated using HPAM polymer. Figure 5a–d shows the IFT for mixtures of various surfactants and polymers, where the surfactant concentration was varied while the HPAM concentration remained constant at 2000 ppm. Figure 5e shows that the impact of HPAM on IFT was negligible. At 0 ppm, the IFT was measured at 28 mN/m, and even when the HPAM concentration was increased to 5000 ppm, the IFT remained almost unchanged at 27.9 mN/m. This negligible effect is described as HPAM’s mainly hydrophilic nature and lack of significant amphiphilic properties. HPAM is a water-soluble polymer with a long chain structure containing hydrophilic functional groups. Its molecular structure does not favour strong adsorption at the oil-water interface to cause a substantial reduction in IFT37. The viscosity of the solution increased with the addition of polymers into the aqueous phase. Due to the increase in viscosity, surfactant motion is restricted toward the interface, and the IFT may take longer to achieve a minimum IFT value. Despite this, the minimal IFT obtained for the surfactant and polymer system is the same as that for the polymer-free surfactant system. Hence, the overall EOR system can be enhanced for a particular surfactant concentration in the presence of a polymer. Therefore, adding polymers does not considerably affect the capacity of surfactants to minimise IFT. Figure 5f shows the sequence of images of drops of HPAM solution at different concentrations during IFT measurement.

IFT between the sunflower oil and fixed concentration of 2000 ppm HPAM with varying concentrations of (a) SDS, (b) SDBS, (c) CTAB, (d) DTAB, and (e) Surfactant at 0 ppm. (f) Sequence of an image of drops at different concentrations of HPAM polymer.
Effect of surfactant on contact angle
The wettability of a reservoir rock has a significant impact on interface movement and ensures the displacement of oil via the porous medium. Oil recovery is considerably increased by alterations in wettability to water-wet from oil-wet. Contact angle measurement is a crucial supplemental test to understand the wettability behaviour (oil-wet/water-wet). DI water (no surfactant) was used to measure the contact angle on the prepared (oil-dipped) sandstone rock, which confirmed the intermediate wet by making the contact angle 72.4°, as shown in Fig. 6a. Further, the subsequent studies with the addition of SDS show the contact angle reduction as low as 20° at respective CMC values. In Fig. 6b, SDBS demonstrates a contact angle of 34.2° at the CMC. Beyond this concentration, there is a consistent plateau, even at 4000 ppm, where it was 18.9°. This trend is mirrored in Fig. 6c, d. Likewise, CTAB and DTAB show 30.4° at their respective CMC values; a comparable behaviour is observed. This converts intermediate wet sandstone into water-wet, the preferred requirement for better oil recovery. Anionic surfactants can alter wettability by hydrophobic interaction. Cationic surfactants modify wettability via electrostatic attraction between their positively charged headgroups and negatively charged rock surfaces38,39. Figure 6e–h shows the sequence of images of the solution drops on the sandstone rock surface at different concentrations of SDS, SDBS, CTAB, and DTAB, respectively.
Effect of polymer and surfactant-polymer mixtures on contact angle
We conducted experiments to investigate the effects of varying the HPAM concentration alone and in a mix with surfactants on contact angle. The HPAM concentration was fixed at 2000 ppm for the mixtures while the surfactant concentration varied.
Figure 7a shows the effect of polymer on wettability alteration. The contact angle measured on prepared (oil-dipped) sandstone rock for DI water was 72.4°. Adding HPAM had little effect on wettability: the contact angle only dropped from 72.4° to 71.8° at 2000 ppm and to 69.7° at 5000 ppm. Two factors can define the moderate effect of HPAM on wettability alteration. First, HPAM may lack the amphiphilic properties needed to interact effectively with oil at the sandstone interface. Second, its negative charge might limit its adsorption onto the sandstone surface, reducing its capacity to modify wettability.
The effect of a surfactant-polymer mixture on wettability alteration was evaluated by maintaining a fixed HPAM concentration of 2000 ppm and varying the surfactant concentration. For comparison, the response of the surfactant alone is also plotted (see Fig. 7b–e).
Figure 7b, c shows the wettability behaviour of sandstone with HPAM combined with anionic surfactants (SDS and SDBS). The results indicate that adding HPAM does not significantly change the contact angle compared to using the surfactant alone. Similarly, Fig. 7d, e shows that adding HPAM to cationic surfactant systems (CTAB and DTAB) has a negligible change in the contact angle. This behaviour is similar to that shown in Fig. 5a–d, which shows that adding HPAM to the surfactant does not alter the IFT, indicating its inactivity at the surface.

Contact angle at different concentrations of surfactant (a) SDS, (b) SDBS, (c) CTAB, (d) DTAB. The sequence of images of drops on the sandstone rock surface at different concentrations of surfactant (e) SDS, (f) SDBS, (g) CTAB, and (h) DTAB at 25 ± 2 oC.
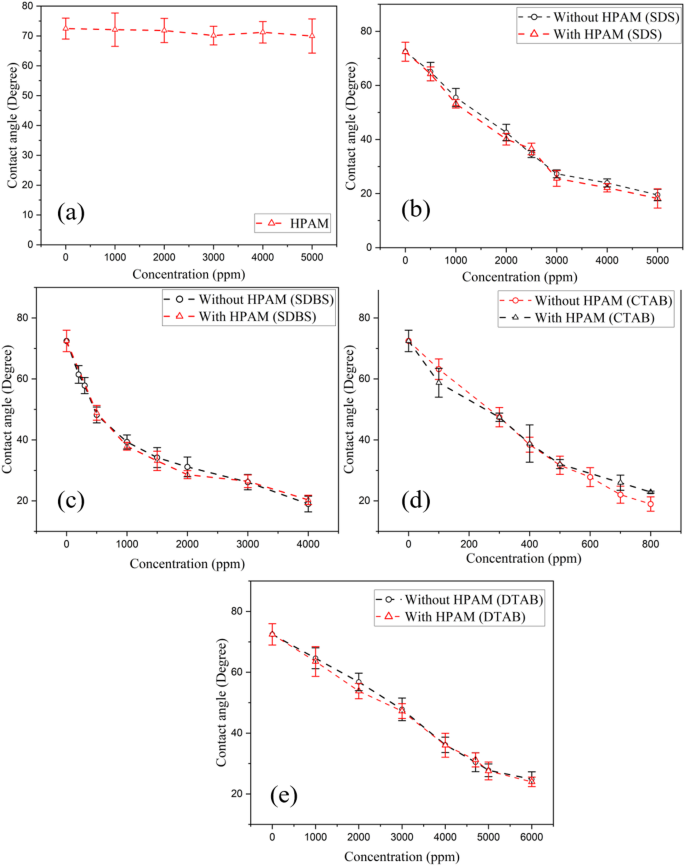
Contact angle values for (a) HPAM, (b) HPAM (2000 ppm) with varying SDS concentrations, (c) HPAM (2000 ppm) with varying SDBS concentrations, (d) HPAM (2000 ppm) with varying CTAB concentrations, (e) HPAM (2000 ppm) with varying DTAB concentrations.
Effect of polymer and surfactant–polymer mixtures on viscosity
The viscosity of the polymer and the mixture of surfactants and polymer were measured at a fixed shear rate of 100 S−1 and a temperature of 25 oC, 50 oC, 75 oC and 90 oC using the rheometer (Anton Paar, MCR702e).
Figure 8a shows the relationship between the concentration of HPAM and its viscosity. It has been observed that as the concentration of HPAM increases, the viscosity also increases. At a concentration of 0 ppm, the viscosity was 1.2 mPa·s at a temperature of 25 °C. Furthermore, at 2000 ppm, the viscosity increased to 3.3 mPa·s and at 5000 ppm, it reached 4.8 mPa·s. The increase in viscosity can be attributed to the long polymer chains that become entangled with other polymer chains, impeding flow and enhancing the fluid’s viscosity. Similarly, concentration dependent viscosity was also measured by varying the temperatures from 50 to 90 °C, As the temperature increases, the viscosities decrease for instance, at 2000 ppm the viscosity drops from 2.5 mPa·s at 50 °C to 1.9 mPa·s at 75 °C and 1.7 mPa·s at 90 °C, reflecting the enhanced polymer chain mobility at higher temperature.
Figure 8b-c shows the mixture viscosity, where the HPAM concentration was maintained at 2000 ppm (viscosity = 3.3 mPa.s) while the anionic (SDS and SDBS) surfactant concentration varied. It was observed that, for both SDS and SDBS, an increase in concentration led to a decrease in the mixture’s viscosity. This reduction occurred because the Na⁺ ions, produced through the dissociation of SDS and SDBS, interacted with the negatively charged sites on the HPAM polymer chains. These interactions neutralised the charges on the polymer, affecting its conformation and reducing its hydrodynamic radius. As a result of this lower entanglement, the mixture’s viscosity decreased37. Additional tests at 50 °C, 75 °C, and 90 °C showed that both SDS-HPAM and SDBS-HPAM mixtures exhibit further viscosity reductions with temperature. For example, at 2000 ppm surfactant, SDS-HPAM falls from 1.5 mPa·s (50 °C) to 1.2 mPa·s (75 °C) and 1.0 mPa·s (90 °C), while SDBS-HPAM drops from 1.4 mPa·s to 1.1 mPa·s and 0.9 mPa·s over the same temperature range.
Figure 8d-e shows the viscosity of the mixture, where HPAM concentration was maintained at 2000 ppm, and the cationic surfactant (CTAB and DTAB) concentration varies based on its CMC value. Adding these surfactants reduces the solution’s viscosity due to electrostatic interactions between the positive CTAB and DTAB head groups and the negative carboxylate groups on HPAM chains. This neutralisation minimises charge repulsion along the HPAM backbone, causing the chains to coil compactly, reducing their hydrodynamic volume and overall viscosity. Moreover, when measured at 50 °C, 75 °C, and 90 °C, both CTAB-HPAM and DTAB-HPAM mixtures show further viscosity declines with increasing temperature. At 2000 ppm CTAB, the viscosity falls from 1.6 mPa·s (50 °C) to 1.2 mPa·s (75 °C) and 1.0 mPa·s (90 °C), while DTAB-HPAM drops from 1.5 mPa·s to 1.1 mPa·s and 0.9 mPa·s over the same range.

The viscosity of (a) HPAM, (b) SDS with HPAM (fixed 2000 ppm), (c) SDBS with HPAM (fixed 2000 ppm), (d) CTAB with HPAM (fixed 2000 ppm), and (e) DTAB with HPAM (fixed 2000 ppm) at a shear rate of 100 S−1 and a temperature of 25 oC, 50 oC, 75 oC and 90 oC.
Effect of polymer, surfactant, and salt on waxy crude oil
Figure 9a–c shows the IFT with the surfactant, polymer, and salt addition. Figure 9a shows that the IFT decreases with adding both anionic (SDS and SDBS) and cationic (CTAB and DTAB) surfactants at their CMC values with waxy crude oil. In the case of ionic surfactants, SDBS shows the lowest value of IFT at 1500 ppm, which is 2.5 mN/m, and for cationic surfactants, DTAB shows its lowest value of IFT at 4700 ppm, which is 2.5 mN/m. Addition of polymers does not show a significant change in IFT, which is essential to reduce the fingering effect (Fig. 9b). Meanwhile, adding salts leads to a further reduction of IFT, as shown in Fig. 9c. In this case, the lowest IFT for SDBS is 0.25 mN/m, and CTAB is 0.4 mN/m for anionic and cationic surfactants, respectively. Figure 10a–c shows the variation of contact angle with the addition of surfactant, polymer, and salts and found that the contact angle decreases from 50 ± 2o to 25 ± 2o at the critical concentration with waxy crude oil.

(a) IFT value for different surfactants at CMC concentration with waxy crude oil, (b) IFT value for different surfactants at CMC concentration and 2000 PPM of polymer with waxy crude oil, (c) IFT value for different surfactants at CMC concentration and critical salt concentration with waxy crude oil.
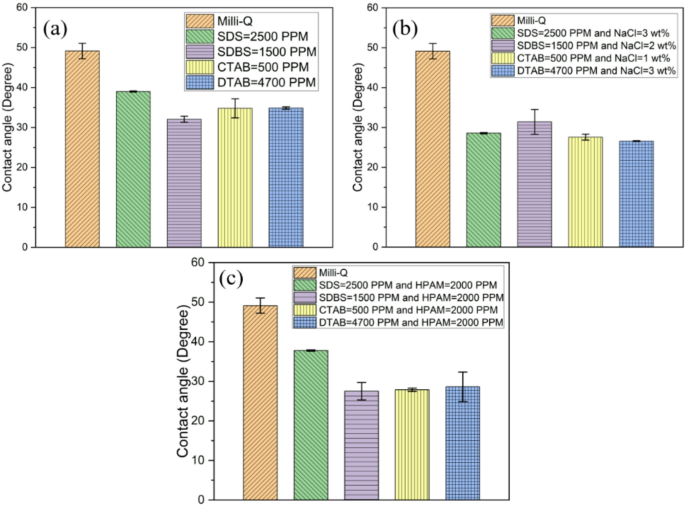
Contact angle for waxy crude oil at different (a) surfactants at CMC, (b) surfactants at CMC and HPAM at 2000 ppm, (c) surfactants at CMC and optimum salt concentration with waxy crude oil.
Characterisation of sandstone rock and surfactantsTGA analysis
Advanced EOR methods involving thermal and gas injection are executed at high temperatures, often in combination with chemical (surfactants) flooding. Hence, it is critical to evaluate the potential degradation of surfactants during exploration. By measuring the weight loss of the surfactants as a function of temperature, TGA may be carried out to assess the surfactant’s thermal stability. Figure 11a-d shows the weight plot against temperature for all four surfactants. SDS was thermally stable up to a temperature of around 200–210 °C before losing weight owing to the breakup of the hydrocarbon chain40. CTAB was stable up to 200 °C before losing weight and decomposing thermally41. DTAB decomposed at 210–230 °C, stable before this, and started losing weight42,43. SDBS is stable up to 400 °C temperature because of the presence of a benzene ring and starts decomposing after 400 °C43.
FTIR and XRF
The sandstone rock used for this study needs to be characterised for its composition; hence, experiments such as FTIR and XRF were conducted. Figure 11e shows the FTIR analysis for the sandstone rock used for the current study. Dry sandstone rock samples include adsorption peaks in the FTIR spectrum at 464 cm−1 and 687 cm−1, associated with asymmetrical and symmetrical bending vibrations of the Si-O molecule, respectively. The stretching vibrations of Si-O, which are symmetric and asymmetric, have adsorption peaks at 790 cm−1 and 1087 cm−1, respectively. It was evident that silica was the primary component of the used rock sample. Hou et al. (2015)44 also reported a similar observation. The XRF composition in Table 2 shows that silica was the dominant oxide (87.78%), with the composition of other oxides. As a result, the formation is a sandstone rock with a significant quartz content. Tackie-Otoo et al. (2021)45 reported a similar observation: silica was the dominating oxide (95.2%).

TGA analysis of surfactants. (a) SDS, (b) SDBS, (c) CTAB, (d) DTAB, and (e). FTIR analysis of sandstone rock.