This is missing the population who didn’t vote at all. I would like to see that too. Not a critique, just a comment.
Can we find out how low income white people voted? I’d love to see that crosstab in light of the Medicaid cuts from the OBBB
All the Hispanics that voted trump are doing the surprised Pikachu face now that ICE is rounding them up like the fucking SS. He literally said he would do it day one, I don’t understand
The moral is we gotta take the voting rights out from boomers and gen X /s
Charts like this which leave out the proportion that didn’t vote are misleading at best.
Black folks really tried to warn you all, wow.
It’s shocking to see such a difference between them and the others, but also not shocking at all.
God damn boomers again had to ruin the world
First let’s have the real votes count. Rockland County New York did not have many area precincts with zero Harris votes. In North Carolina the votes for Harris were far lower than for other democratic candidates for other seats.
What is most amazing is that this poll was released last week. I don’t know when they took their data, but presumably it was was after Trump had time to let his Nazi flag fly.
So these are the people that still admit voting for Trump, even as Trump shits on the population of the USA.
Props for American honesty I guess.
People never seem to mention how slim the difference is in how Asian men and Asian women vote.
The USA is doomed. This chart proves the voting bases live in time warps and myoptic realities.
I wonder how the German vote / opinion / parliament breakdown in 1932 and following years would have looked by demographic
Why do so many people blame men (especially young men) for giving this election to Trump when nearly half of women also voted for him?
Personally, I’d like to see this data for just the 7-8 swing states, as they decide the election via the Electoral College.
I wish we could overlay population volume somehow to see how it impacted the overall percentage.
Also, interesting how the data suggests the age divide among women was more dramatic than the racial divide between white and Hispanic women.
There’s a 15-point swing between women under 50 (who broke for Harris +14) and women over 50 (who broke for Trump +1). That’s a much larger cleavage than the 6-point difference between how white women and Hispanic women voted.
It really highlights how age predicts voting.
Data is beautiful yes, but tainted data leads to a false result. Data depends on how the data is collected. For example every 10 years there is a political fight over the US Census data collection process. [https://electiontruthalliance.org/eta](https://electiontruthalliance.org/eta)
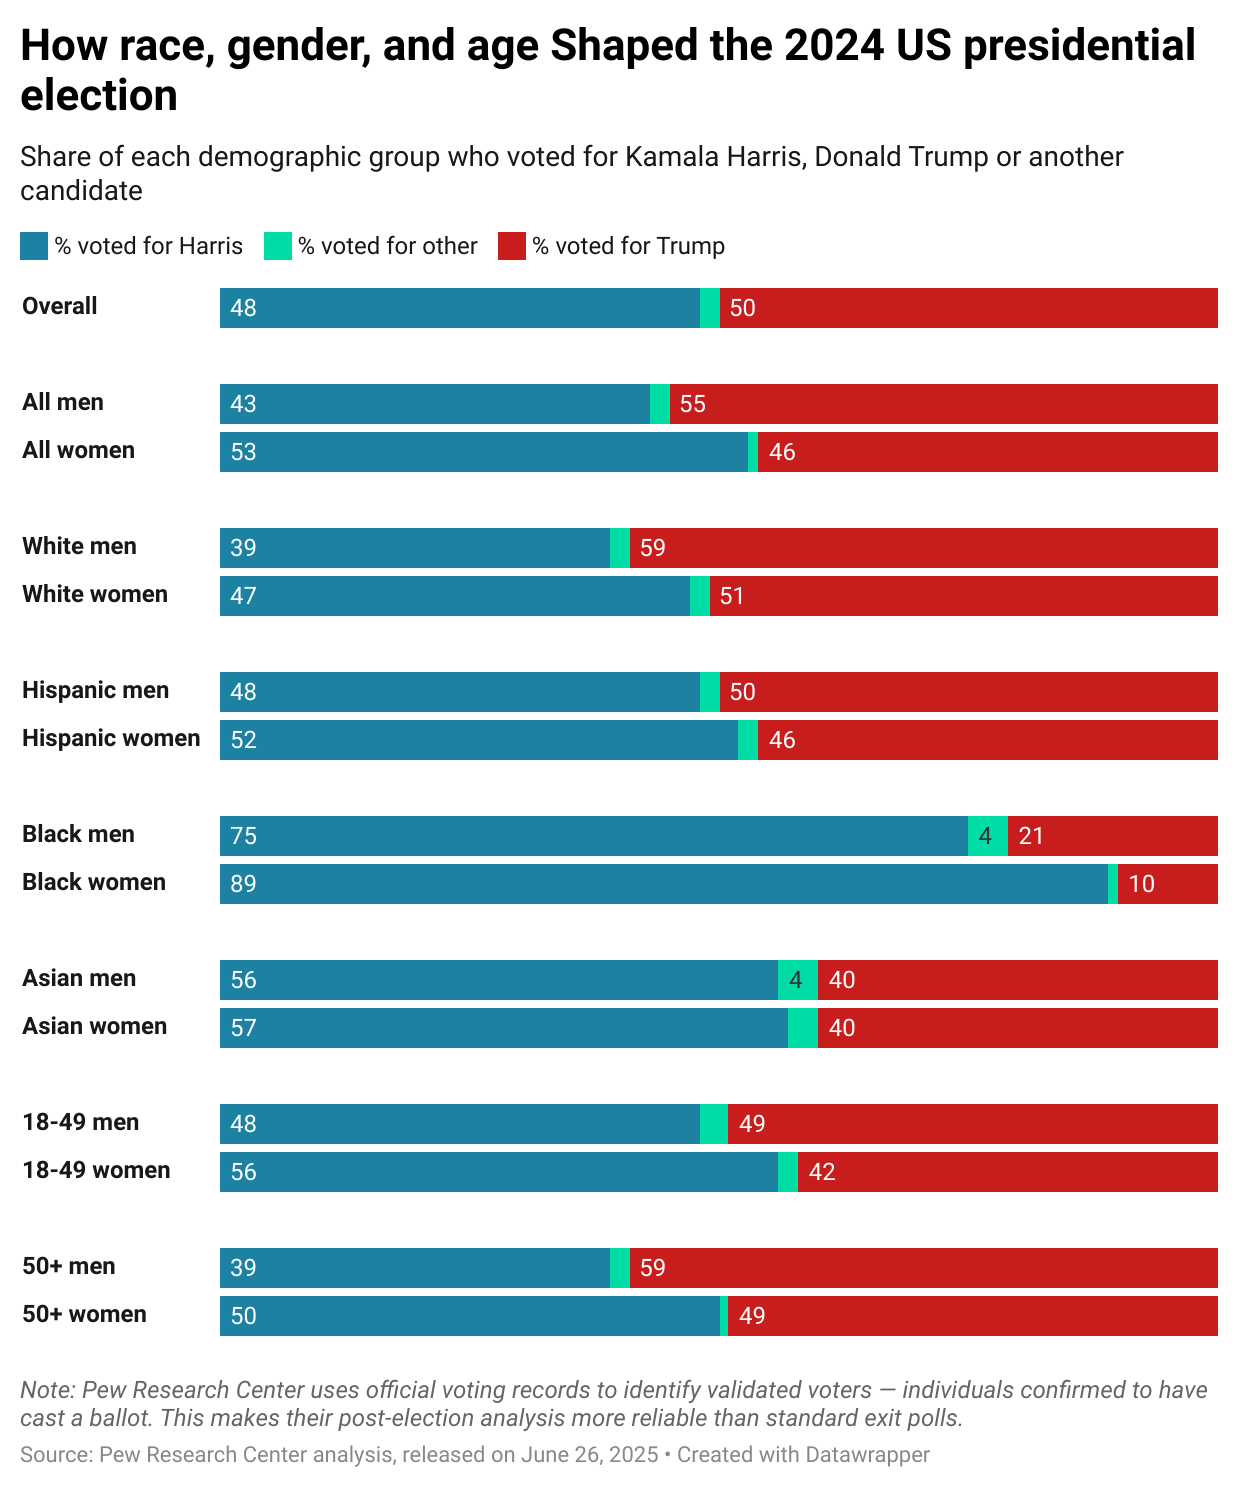
![[OC] How race, gender and age shaped the 2024 US presidential election](https://www.europesays.com/wp-content/uploads/2025/07/aqfzli1q1naf1-1240x1024.png)
19 comments
Source: [Pew Research Center ](https://www.pewresearch.org/politics/feature/how-changes-in-turnout-and-vote-choice-powered-trumps-victory-in-2024/)
Tools: [Datawrapper ](https://www.datawrapper.de/)
[deleted]
https://preview.redd.it/6naht0d63naf1.jpeg?width=960&format=pjpg&auto=webp&s=43bc3d99f5ec6311cd48461570bce2a72dd6bded
Vindicated
This is missing the population who didn’t vote at all. I would like to see that too. Not a critique, just a comment.
Can we find out how low income white people voted? I’d love to see that crosstab in light of the Medicaid cuts from the OBBB
All the Hispanics that voted trump are doing the surprised Pikachu face now that ICE is rounding them up like the fucking SS. He literally said he would do it day one, I don’t understand
The moral is we gotta take the voting rights out from boomers and gen X /s
Charts like this which leave out the proportion that didn’t vote are misleading at best.
Black folks really tried to warn you all, wow.
It’s shocking to see such a difference between them and the others, but also not shocking at all.
God damn boomers again had to ruin the world
First let’s have the real votes count. Rockland County New York did not have many area precincts with zero Harris votes. In North Carolina the votes for Harris were far lower than for other democratic candidates for other seats.
What is most amazing is that this poll was released last week. I don’t know when they took their data, but presumably it was was after Trump had time to let his Nazi flag fly.
So these are the people that still admit voting for Trump, even as Trump shits on the population of the USA.
Props for American honesty I guess.
People never seem to mention how slim the difference is in how Asian men and Asian women vote.
The USA is doomed. This chart proves the voting bases live in time warps and myoptic realities.
I wonder how the German vote / opinion / parliament breakdown in 1932 and following years would have looked by demographic
Why do so many people blame men (especially young men) for giving this election to Trump when nearly half of women also voted for him?
Personally, I’d like to see this data for just the 7-8 swing states, as they decide the election via the Electoral College.
I wish we could overlay population volume somehow to see how it impacted the overall percentage.
Also, interesting how the data suggests the age divide among women was more dramatic than the racial divide between white and Hispanic women.
There’s a 15-point swing between women under 50 (who broke for Harris +14) and women over 50 (who broke for Trump +1). That’s a much larger cleavage than the 6-point difference between how white women and Hispanic women voted.
It really highlights how age predicts voting.
Data is beautiful yes, but tainted data leads to a false result. Data depends on how the data is collected. For example every 10 years there is a political fight over the US Census data collection process. [https://electiontruthalliance.org/eta](https://electiontruthalliance.org/eta)
Comments are closed.