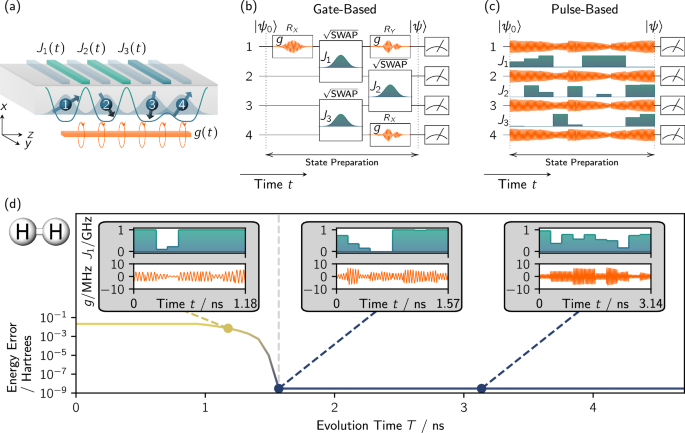
We use a Heisenberg spin-chain model21,43 to describe a typical 1D chain of spin qubits in SiMOS heterostructures23,25,34,38 [see Fig. 1a]:
$$\,\hat{H}\,\left(t\right)\,=\,{-}\mathop{\sum }\limits_{i=1}^{N}\,\frac{{B}_{i}}{2}{\hat{\sigma }}_{z}^{\left(i\right)}\,-\,\frac{g\,\left(t\right)}{2}\,\,\mathop{\sum }\limits_{i=1}^{N}\,{\hat{\sigma }}_{x}^{\left(i\right)}+\,\,\,\mathop{\sum }\limits_{i=1}^{N-1}\,\frac{{J}_{i}\,\left(t\right)}{4}{\vec{\hat{\sigma }}}^{\left(i\right)}\cdot {\vec{\hat{\sigma }}}^{\left(i+1\right)}.\,$$
(1)
Here, \({\vec{\hat{\sigma }}}^{\left(i\right)}=\left({\hat{\sigma }}_{x}^{(i)},{\hat{\sigma }}_{y}^{(i)},{\hat{\sigma }}_{z}^{(i)}\right)\) is a vector of Pauli operators. It describes the spin of a single electron trapped in the ith quantum dot under a plunger gate. Note that, we follow the encoding of Burkard et al.,21 where \(\left\vert 0\right\rangle \equiv \left\vert \!\downarrow \right\rangle\) and \(\left\vert 1\right\rangle \equiv \left\vert \!\uparrow \right\rangle\).
An external magnetic field (≈1 T) induces a Zeeman splitting of Bi = B + ΔBi on the electron spin in the ith dot with an average value of \(B=\frac{1}{N}\mathop{\sum }\nolimits_{i = 1}^{N}{B}_{i}\) (≈28 GHz)38. We assume detunings of Bi+1 − Bi = ΔB, similar to Huang et al.34 and Yoneda et al.38, where ΔB is approximately 10 MHz to 30 MHz.
Single-qubit operations are achieved via electron-spin resonance using a microwave antenna44 [see Fig. 1(a)], which induces a time-dependent global magnetic field in the x-direction. The field induced by the microwave drive is proportional to
$$\begin{array}{r}g\left(t\right)=\mathop{\sum }\limits_{i=1}^{N}\left[{I}_{i}\left(t\right)\cos \left({\omega }_{i}t\right)+{Q}_{i}\left(t\right)\sin \left({\omega }_{i}t\right)\right].\end{array}$$
(2)
The field can be produced with an arbitrary waveform generator, where \({I}_{i}\left(t\right)\) and \({Q}_{i}\left(t\right)\) are the in-phase and quadrature components of N microwave pulses with carrier frequency ωi, respectively. Typically, \(| {I}_{i}\left(t\right)|,| {Q}_{i}\left(t\right)| \le\)10 MHz40 and ωi usually varies by up to 1 GHz from the Zeeman splitting (depending on the bandwidth of the arbitrary waveform generator).
Finally, two-qubit operations are induced via nearest-neighbor exchange couplings between spin i and i + 1. This entangling operation is controlled by voltage pulses on the barrier gates, which alters the exchange strength Ji(t). Typically, Ji(t) ≤ 10 MHz,28,33,34 but exchange couplings in SiMOS as large as Ji(t) ≈ 1 GHz have been measured39. Moreover, the control of fast exchange pulses has previously been demonstrated in GaAs45,46. As we will show below, fast exchange is crucial to achieve short METs.
The parameters of our spin-chain model are summarized in Table 1. As discussed above, these parameters describe realistic SiMOS devices34,38,39,40. Similar parameters also describe electron spin-qubits in Silicon/SiliconGermanium (Si/SiGe) heterostructures30,31,32,35,41,42,47. In Si/SiGe, the Zeeman-splitting inhomogeneity and \(g\left(t\right)\) originate from micromagnets48 and electron-dipole spin-resonance type driving via the confinement gate,30,31,32,35,47 respectively. As with SiMOS devices, experiments in Si/SiGe tend to use slow exchange (Ji(t) ≤ 10 MHz)30,31,32,35,47. However, fast exchange (Ji(t) ≈ 1 GHz) has been demonstrated by Weinstein et al.42 and Simmons et al.41.
Pulse-based state preparation
In conventional gate-based approaches, a target quantum state is prepared by evolving an initial state through a sequence of quantum gates. These gates are implemented by executing pre-optimized control pulses to realize the specific parameterized single- and fixed two-qubit gates. In Supplementary Note 2, we also allow two-qubit gates to be parameterized and calculate gate-based state-preparation times. These times serve as lower bounds for state preparation with fixed two-qubit gates. In contrast, pulse-based state preparation is realized by directly optimizing the control pulses that drive the device state through a hardware’s native interactions. Since gate-based state preparation is less flexible, in a variational sense, pulse-based state preparation can be executed in shorter times.
A device-agnostic implementation of pulse-based state preparation utilizing variational pulse-shaping11,49 consists of three steps: (i) The input is a cost Hamiltonian \(\hat{C}\) whose (potentially unknown) ground state \(\left\vert \phi \right\rangle\) we wish to prepare. For example, \(\hat{C}\) can encode a molecular Hamiltonian50. It can always be expressed as a linear combination of Pauli strings2,50 whose expectation value, in the case of physically relevant problems, can be sampled efficiently2. (ii) We fix the total evolution time T and prepare the qubit register in the state \(\left\vert \psi ({\boldsymbol{x}};T)\right\rangle\). Here, x denotes the control parameters of the silicon processor. (iii) These parameters are iteratively tuned using a classical optimizer to obtain the minimal expectation value
$$\begin{array}{r}C(T):=\mathop{\min }\limits_{{\boldsymbol{x}}}\left\{\langle \psi ({\boldsymbol{x}};T)| \hat{C}| \psi ({\boldsymbol{x}};T)\rangle \right\}.\end{array}$$
(3)
Provided that T is sufficiently large and x sufficiently expressive, variational pulse-shaping yields \(\left\vert \psi ({{\boldsymbol{x}}}_{\star };T)\right\rangle =\left\vert \phi \right\rangle\) for the optimal parameters x⋆.
Within our device model, variational pulse-shaping can be implemented as follows: Working in the frame rotating with the drift Hamiltonian \({\hat{H}}_{D}:=-\frac{1}{2}\mathop{\sum }\nolimits_{i = 1}^{N}\,{B}_{i}{\hat{\sigma }}_{z}^{\left(i\right)}\), we numerically integrate the Schrödinger equation of \(\hat{H}\). This yields the state \(\left\vert \psi ({\boldsymbol{x}};T)\right\rangle\) in the rotating frame. We optimize its control parameters \({\boldsymbol{x}}:=\{{I}_{i}\left(t\right),{Q}_{i}\left(t\right),{J}_{j}\left(t\right),{\omega }_{i}\}\) within the constraints of Table 1. We use the quadrature parameterization of \(g\left(t\right)\) instead of the polar parameterization to make optimization easier10. Further, we parametrize each control using a piecewise constant function for convenience. We use M segments of duration Δt = T/M. For each \(t\in \left[\left(m-1\right)\Delta t,m\Delta t\right)\) with m = 1, . . . , M we set \({I}_{i}\left(t\right)={I}_{i,m}\), \({Q}_{i}\left(t\right)={Q}_{i,m}\) and \({J}_{j}\left(t\right)={J}_{j,m}\). We then use the gradient ascent pulse-engineered (GRAPE) algorithm49 to find the parameters that achieve the minimal cost C(T).
Figure 1(d) illustrates numerically calculated C(T)s where \(\hat{C}\) encodes the Hamiltonian of H2. For large T, GRAPE finds control parameters, such that \(\left\vert \psi ({\boldsymbol{x}};T)\right\rangle\) approches the ground state \(\left\vert \phi \right\rangle\) of H2 and C(T) approaches the H2 ground-state energy C0 of \(\hat{C}\). For sufficiently small T, GRAPE does not find control parameters that generate the ground state of H2, and the energy error Δ(T) := C(T) − C0 increases monotonically as T decreases. The time below which all Δ(T) > ε := 10−7 Hartrees is a numerical estimate of the minimal evolution time (MET). Below the MET, a silicon quantum processor can no longer accurately prepare the ground state of \(\hat{C}\). Thus, hardware-specific METs provide lower bounds on the time of desired quantum evolutions. A byproduct of estimating the MET are the pulse shapes found by the optimizer at various total evolution times T. These optimal pulse shapes are not unique for total evolution times T ≥ MET and often are neither easily interpretable nor insightful. Nonetheless, we include three examples in Fig. 1(d). See Algorithm 1 for pseudocode outlining the procedure for estimating the MET. A protocol for implementing variational pulse-shaping and MET searches in experiments, based on the works of Rubin, Babbush, and McClean51 and Hoeffding52, is given in Supplementary Note 3.
Algorithm 1
Estimating the MET
1: Input trial times \({\mathcal{T}}\), parameter Initializations
2: for T in \({\mathcal{T}}\) do
3: \(C\left(T\right)\leftarrow \infty\)
4: for x in Initializations do
5: while x has not converged do ⊳ Optimization loop
6: \(\left\vert \psi ({\boldsymbol{x}};T)\right\rangle \,\leftarrow\) Numerically evolve \(\left\vert {\psi }_{0}\right\rangle\) for a time T
7: Evaluate \(C\left({\boldsymbol{x}};T\right):=\langle \psi ({\boldsymbol{x}};T)| \hat{C}| \psi ({\boldsymbol{x}};T)\rangle\)
8: Backpropagate to find \({\nabla }_{{\boldsymbol{x}}}C\left({\boldsymbol{x}};T\right)\)
9: Optimizer updates x with loss function \(C\left({\boldsymbol{x}};T\right)\) and gradient \({\nabla }_{{\boldsymbol{x}}}C\left({\boldsymbol{x}};T\right)\)
10: if \(C\left({\boldsymbol{x}};T\right)\, then
11: Optimal parameters x⋆ \(\leftarrow\) x
12: \(C\left(T\right)\leftarrow C\left({{\boldsymbol{x}}}_{\star };T\right)\)
13: if C0 is known a priori then ⊳ The case in this article
14: MET\(\approx \min \left\{T{\ \rm{in}\ }{\mathcal{T}}:C\left(T\right)-{C}_{0}\le \varepsilon \right\}\)
15: else
16: MET\(\approx \min \left\{T{\ \rm{in}\ }{\mathcal{T}}:C\left(T\right)\,-\,C\left(T^{\prime} \right)\,\le \,\varepsilon {\ \rm{for}}\,{\rm{all}\ }\,T^{\prime} \,\ge \,T\right\}\)
Molecular ground states
In this section, we investigate the silicon processor’s METs for variational pulse-based state preparation of molecular ground states. To facilitate comparison with previous works on superconducting hardware, we consider the molecules H2, HeH+, and LiH with the same molecular Hamiltonians as Meitei et al.11 We work in the STO-3G basis and use parity encoding that block diagonalizes the Hamiltonians. We then identify \(\hat{C}\) with the block containing the ground state. We permute our basis so that the Hartree Fock state is given by \(\left\vert 01\right\rangle\) for H2 and HeH+, and \(\left\vert 0011\right\rangle\) for LiH—we then take these states as our initial states. Note that the same initial states were used byMeitei et al.11 to analyse superconducting hardware. The time required to prepare these initial states is not counted towards the MET.
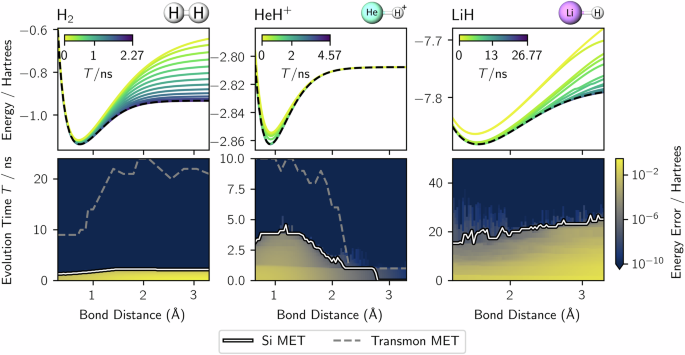
Using the pulse-shaping methods of the previous section, we numerically calculate the molecular energies C(T) of H2, HeH+, and LiH as functions of the bond distances for a range of evolution times T. See “Methods (Molecular dissociation curve scanning)” section for numerical details and Fig. 2 (top row) for results. At zero evolution time T = 0, the prepared state is the Hartree-Fock state, and the molecular energy C(0) is the Hartree-Fock energy. A yellow line shows the corresponding dissociation curve. As T increases, the (increasingly blue) dissociation curves C(T) converge to the full configuration interaction (FCI) energies C0, marked by a black dashed curve. For T = MET, the (purple) dissociation curve C(MET) is identical to the (FCI) energies C0. The color bar is truncated at the largest MET from the scanned bond distances.
(top) Molecular energy C(T) as a function of bond distance for a range of evolution times. At zero evolution time, C(0) corresponds to the (yellow) Hartree-Fock disassociation curve of the initial state. At the MET, the energy C(T = MET) (blue dissociation curve) converges to the full configuration interaction (FCI) energy C0 (dashed black curve). (bottom) Energy error Δ(T) := C(T) − C0 on a logarithmic color scale as a function of bond distance and evolution time. A white line shows the silicon METs. A dashed (gray) curve marks transmon METs11.
To identify the METs for molecular ground-state preparation of H2, HeH+, and LiH, we plot the energy error Δ(T) := C(T) − C0 as a function of bond distance and evolution time T. The results are shown in Fig. 2 (bottom row). For each bond distance, Δ(T) shows a sharp increase as T decreases. For numerical purposes, we estimate the MET as the point where Δ(T) = ε := 10−7 Hartrees. In reality, one may not know C0 a priori and can seek a plateau in C(T) at large times to identify C0—see Line 16 of Algorithm 1. A white line highlights the silicon METs. For HeH+, the MET drops to zero at a large bond distance because the Hartree-Fock state converges to the true FCI ground state. For H2, HeH+, and LiH we obtain METs as small as 2.3 ns, 4.6 ns, and 27 ns, respectively. For comparison, a gate-based circuit for preparing arbitrary states on two qubits requires at least 200 ns(see Supplementary Note 2 and the work of Žnidarič, Giraud, and Georgeot53). Further, these METs are one order of magnitude faster than the fastest single qubit π rotations in silicon27,54. These silicon METs are also one order of magnitude faster than the numerically-estimated METs for superconducting transmon qubits,11 which are shown as gray dashed lines in Fig. 2 (bottom row).
The pulse-shaping methods outlined in the “Methods” section may not scale favorably. However, our work aims to investigate the ultimate performance limits of VQAs in silicon on small numbers of qubits. Presenting a scalable method to achieve this optimal performance at large qubit numbers is a task left for future investigation. Nonetheless, our results fuel the hope that pulse-based variational state preparation methods could significantly accelerate the state preparation in quantum chemistry and, thus, make near-term quantum algorithms on silicon quantum processors more resilient to noise.
It is now natural to ask: How does the MET depend on the device parameters? We answer this question in the Section on the “Dependence of minimal evolution times on silicon device parameters.” But first, we consider METs of transitions between random states. Readers who are primarily interested in quantum computational chemistry simulations may skip ahead.
Random state transitions
In this section, we determine the METs for transitions between arbitrary states. As the initial state for this task is no longer necessarily close to the target state, we expect longer METs compared to chemistry or physics problems, where the mean-field solution is often a good starting point. We find that for systems with two, three, or four qubits, the slowest MET is still faster than the fastest possible single-qubit π gate. Further, we theoretically characterize the distribution of METs between Haar-random states.
To numerically investigate the MET to transition from an initial state \(\left\vert {\psi }_{0}\right\rangle\) to a target state \(\left\vert \phi \right\rangle\) on N qubits, we consider the infidelity between the evolved state \(\left\vert \psi ({\boldsymbol{x}};T)\right\rangle\) and the target state \(\left\vert \phi \right\rangle\):
$$C(T):=1-\mathop{\max }\limits_{{\boldsymbol{x}}}\left\{{\left\vert \langle \psi ({\boldsymbol{x}};T)| \phi \rangle \right\vert }^{2}\right\}.$$
(4)
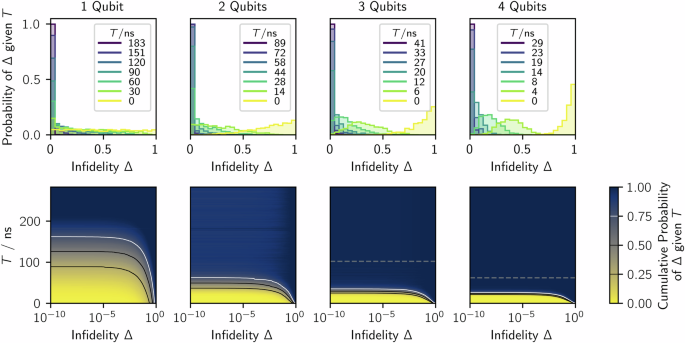
First, using variational-pulse shaping, we numerically estimate the probability distribution of the infidelity C(T) for a range of total evolution times—see “Methods” section for numerical details and see Fig. 3 (top row) for results. This distribution is independent of the rotating frame—see Supplementary Note 4 for proof. For T = 0 (yellow histogram), the distribution of infidelities is broad, indicating the broad range of overlaps \({\left\vert \langle {\psi }_{0}| \phi \rangle \right\vert }^{2}\) between Haar-random state pairs prior to time evolution. (An analytical expression for this initial distribution is given in Eq. (16) in Supplementary Note 5). As T increases (increasingly blue histograms), the evolved input states \(\left\vert \psi ({\boldsymbol{x}};T)\right\rangle\) increase their overlap with the corresponding target states \(\left\vert \phi \right\rangle\). This shifts the histograms towards lower infidelities. Moreover, as T increases, an increasing fraction of states \(\left\vert \psi ({\boldsymbol{x}};T)\right\rangle\) reaches the target state \(\left\vert \phi \right\rangle\), leading to an increasing peak of the histograms around infidelity equal to zero. Finally, as the MET for the hardest-to-connect state pair is reached, the (purple) infidelity histogram entirely localizes around infidelity equal to zero. Further, we show the cumulative distribution of the infidelity, \({\mathbb{P}}\left(C\left(T\right)\le \Delta | T\right)\), on a log scale along the horizontal axis and as a function of the evolution time T along the vertical axis in the bottom row of Fig. 3.
(Top) Infidelity of 1024 Haar-random state pairs as histograms. Histogram colors indicate the evolution time T as depicted by the insets. (Bottom) Cumulative distribution of infidelities as a color map, with infidelity on a log scale on the horizontal axis and evolution time T on the vertical axis. (Right two columns bottom) Numerically calculated data is below the dashed lines, while extrapolated data is above. We average the ten distributions with T just below the dashed curves for extrapolation.
Second, in Fig. 4, we estimate the cumulative distribution of the MET, \({\mathbb{P}}\left({\rm{MET}}\le T\right)\)—see “Methods” section for numerical details. A blue-shaded region marks the corresponding confidence interval of 99.99%. For comparison, we overlay the time required by the same processor to implement \(\frac{1}{\sqrt{2}}\left(X\pm Y\right)\) (the fastest single-qubit π-gate), X, Y, and \(\sqrt{{\rm{SWAP}}}\) gates as blue vertical lines in Fig. 4. In a single-qubit system, the time for operating the fastest π-gate is slightly shorter than the MET of the hardest-to-connect state pairs. However, for systems with two or more qubits, we observe that even the slowest random state transitions can be accomplished in less than the time set by the fastest single-qubit π-gate. This may imply that embedding hard-to-connect single-qubit states into a system with two or more qubits could accelerate the transition between one qubit states by using, e.g., fast exchange interactions in the expanded space of neighboring qubits. This effect is reminiscent of accelerated state preparation through excited states in superconducting devices9 and will be investigated in more detail in future works.
The black solid curves represent numerically estimated cumulative probability distributions. The shaded region corresponds to a 99.99% confidence interval (CI) estimated via 105 bootstrap resamples (see “Methods” section). Vertical blue lines mark typical gate times. The dashed purple and orange curves are the homogeneous and isotropic (HI) fits and higher-order fits, respectively. For details on the fitting, see “Methods” section.
Third, in Supplementary Notes 5 and 6, we derive two expressions (see “Methods” section) for the cumulative distribution of the MET to support our numerical data in Fig. 4. The first expression [Eq. (5)] assumes that the local quantum speed limit is homogeneous and isotropic in the manifold of N-qubit states—the Bloch sphere for a single qubit. We fit this expression to the numerical data in Fig. 4 to obtain the dashed purple curves. However, in general, the assumption of homogeneity and isotropy will not hold—as in our particular hardware. For example, in our simulations of silicon hardware, we fix the maximum values for \({I}_{i}\left(t\right)\) and \({Q}_{i}\left(t\right)\), which induce X and Y rotations, respectively. We can rotate a state about the \(\frac{1}{\sqrt{2}}\left(X\pm Y\right)\) axes by simultaneously driving \({I}_{i}\left(t\right)\) and \({Q}_{i}\left(t\right)\). Thus, rotations about the \(\frac{1}{\sqrt{2}}\left(X\pm Y\right)\) axes will be a factor of \(\sqrt{2}\) faster than about the X or Y axes. This effect can be seen in Fig. 5. Our second expression [Eq. (6)] generalizes the first by adding a series of correction terms to account for the inhomogeneity and anisotropy. We fit the generalized expression to obtain the dashed orange curves in Fig. 4.
a A color plot on the surface of the Bloch sphere of the MET to prepare each state of the Bloch sphere in the rotating frame of the drift Hamiltonian from the \(\left\vert 0\right\rangle\) state. The color scale is chosen to emphasize the anisotropy in preparing states on the equator of the Bloch sphere. b Trajectories on the Bloch sphere (viewed from the north pole) that achieve each MET. The semi-transparent trajectories build up a density map that demonstrates trajectories predominantly travel along the \(\frac{1}{\sqrt{2}}\left(X\pm Y\right)\) “highways”. Traveling along these highways mitigates the impact of the anisotropy on the MET. c The trajectories that end on the equator of the Bloch sphere. Trajectories tend to localize to the highways. The color along each trajectory indicates elapsed time. Notice the square pattern to the colouration showcasing the \(\sqrt{2}\) speed-up along the \(\frac{1}{\sqrt{2}}\left(X\pm Y\right)\) over the X or Y directions.
Dependence of minimal evolution times on silicon device parameters
In this section, we investigate how silicon METs depend on the device parameters and their experimental bounds in a silicon processor. In particular, we investigate the dependence of METs on the maximal drive strength, \({{\rm{IQ}}}_{\max }\), the maximal exchange coupling \({J}_{\max }\), and the Zeeman-splitting inhomogeneity ΔB. The investigation is motivated by gate-based qubit operations in silicon. On the one hand, \({{\rm{IQ}}}_{\max }\) is known to limit the speed of single-qubit operations, which are known to be relatively slow27. On the other hand, \({J}_{\max }\) is known to enable relatively fast two-qubit power-of-SWAP gates27. We investigate whether similar parameter limitations apply to pulse-based state preparation.
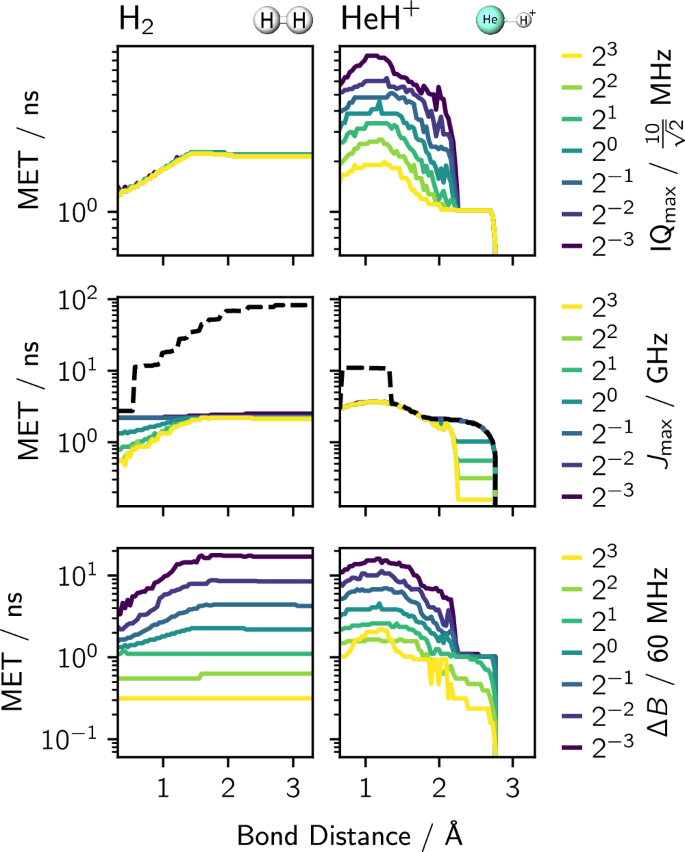
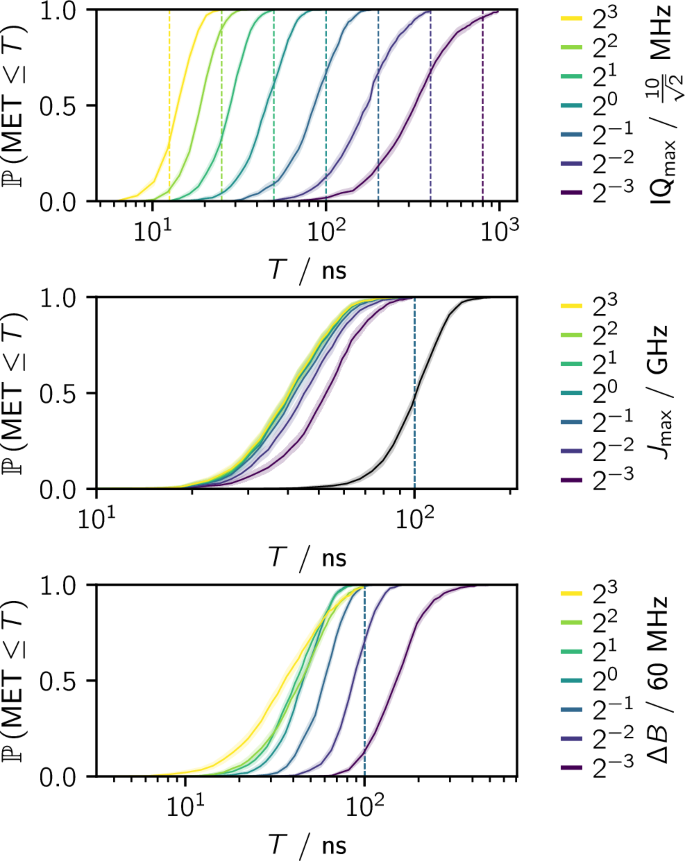
To begin with, we investigate the influence of microwave drives, exchange couplings, and Zeeman-splitting inhomogeneities on METs for molecular ground-state preparation. To this end, we extend the numerical investigation of molecular ground states and determine the METs for H2 and HeH+ for a range of device parameters. The data is shown in Fig. 6, where colored curves depict the MET. The top, center, and bottom panels show METs where \({{\rm{IQ}}}_{\max }\), \({J}_{\max }\), and ΔB are varied independently, relative to their values in Table 1. Roughly speaking, this data confirms that larger \({{\rm{IQ}}}_{\max }\), \({J}_{\max }\), and ΔB lead to faster state-preparation times and thus shorter METs. In addition, we calculate the METs for molecular ground-state preparation (dashed black line in center panels) for \({J}_{\max }=10\,\rm{MHz}\)—a common value for realizing CZ28,30,32,35 or CNOT47 gates. The corresponding METs for H2 and HeH+ become as slow as 82.7 ns and 11.0 ns, respectively. This observation highlights the importance of fast exchange for accelerated state preparation. A deeper discussion of the METs for molecular ground-state preparation of H2 and HeH+ in relation to the single- and two-qubit controls is given below.
Colored curves depict the MET for independently varying (top) the maximal drive strength \({{\rm{IQ}}}_{\max }\), (center) the maximal exchange coupling \({J}_{\max }\), and (bottom) the Zeeman-splitting inhomogeneity ΔB relative to their specified values in Table 1 as decoded by the color bars. The black dashed line in the central row is for \({J}_{\max }=10\,\rm{MHz}\).
Next, we investigate the influence of \({{\rm{IQ}}}_{\max }\), \({J}_{\max }\) and ΔB on transitions between Haar random states. To this end, we extend the numerical investigation of random state transitions and determine the cumulative distribution of the MET. The data is shown in Fig. 7. In the top panel, we apply the device parameters of Table 1 and vary \({{\rm{IQ}}}_{\max }\). As the drive strength varies, the METs are scaled by the same factor. In the center panel, we apply the device parameters of Table 1 and vary \({J}_{\max }\). As the exchange coupling is varied down to 125 MHz, the cumulative METs remain almost identical. These data confirm our intuition that silicon pulse-based METs—similar to gate-based state-preparation times—are, on average, limited by \({{\rm{IQ}}}_{\max }\). However, once \({J}_{\max }\) is reduced to 10 MHz (black curve), we find that the MET starts to increase significantly. Again, this illustrates the importance of fast exchange for achieving small METs. Finally, in the bottom panel, we apply the device parameters of Table 1 and vary ΔB. We find decreasing ΔB from 60 MHz slows state preparation on average, but increasing ΔB from 60 MHz has only a small impact on the MET—i.e., ΔB is on the border of being a limiting factor at 60 MHz.
Single- and two-qubit control analysis
We now discuss, in more detail, how specific microwave and exchange pulses achieve the METs in Figs. 6 and 7. In Supplementary Note 7, we follow a similar derivation to Russ et al.55 and show that the exchange operation in the rotating frame of the drift Hamiltonian is power-of-SWAP like: In the \(\left\vert 01\right\rangle\), \(\left\vert 10\right\rangle\) subspace, it drives population transfer with a phase proportional to ΔBt0/ℏ. Here, t0 is the time at which exchange is turned on (as compared to the start of the pulse at t = 0). Thus, waiting until time t0 before switching on the exchange pulse allows us to adjust the phase between the \(\left\vert 01\right\rangle\) and \(\left\vert 10\right\rangle\) states.
First, consider the MET data for H2 in Fig. 6. For H2, the initial Hartree-Fock state is \(\left\vert 01\right\rangle\). The true ground state (over the range scanned) is well approximated by the state proportional to \(\left\vert 01\right\rangle +\xi {e}^{i\phi }\left\vert 10\right\rangle\). Notably, the absence of \(\left\vert 00\right\rangle\) and \(\left\vert 11\right\rangle\) components in the molecular ground state of H2 indicates that single-qubit gates are not required to prepare the molecular ground state of H2 from \(\left\vert 01\right\rangle\). For that reason, changing \({{\rm{IQ}}}_{\max }\) (top left figure of Fig. 6) has no influence on the MET. Next, to prepare the ground state of H2, we require several applications of the exchange pulse to transfer some population from the initial Hartree-Fock state \(\left\vert 01\right\rangle\) into \(\left\vert 10\right\rangle\) with the correct phase. In Fig. 6 (center left), we can see that, for bond distances less than about 1.5 Å, this transfer tends to happen faster as \({J}_{\max }\) is increased. However, after \({J}_{\max }\) reaches 0.5 GHz the acceleration of the MET slows down. We conjecture that this slowdown is related to a wait time required to build up the correct phase ΔBt0/ℏ. Finally, in Fig. 6 (bottom left), we see that increasing the detuning ΔB tends to accelerate the MET. We conjecture that this observation is related to the fact that a larger ΔB allows for faster accumulation of the phase ΔBt0/ℏ.
Second, for HeH+, we observe three different scenarios in Fig. 6, depending on the bond length. At large bond lengths beyond (≥2.8 Å), the initial Hartree-Fock state \(\left\vert 01\right\rangle\) describes the true ground state with sufficient accuracy—thus, the MET is zero. At intermediate bond distances (2.2 Å to 2.8 Å) the true ground state is approximately proportional to \(\left\vert 01\right\rangle +{\xi}^{\prime} {e}^{i{\phi}^ {\prime} }\left\vert 10\right\rangle\). Neither single-qubit gates nor long wait times t0 are required to adjust the transfer phase ΔBt0/ℏ of the exchange pulse. Hence, in that region, the MET is neither dependent on \({{\rm{IQ}}}_{\max }\) nor strongly dependent on ΔB. However, it is inversely proportional to the exchange \({J}_{\max }\). Finally, for smaller bond distances (0.5 Å to 2.2 Å), the true ground state is proportional to \(\left\vert 01\right\rangle +\xi^{\prime\prime} {e}^{i\phi^{\prime\prime} }\left\vert 10\right\rangle +{\delta }_{00}\left\vert 00\right\rangle +{\delta }_{11}\left\vert 11\right\rangle\), with some amplitudes on \(\left\vert 00\right\rangle\) and \(\left\vert 11\right\rangle\). Preparing the amplitudes on \(\left\vert 00\right\rangle\) and \(\left\vert 11\right\rangle\) requires single-qubit drives; thus, increasing \({{\rm{IQ}}}_{\max }\) decreases the MET proportionally, see Fig. 6 (top right). Finally, the exchange pulse is needed to prepare probability in \(\left\vert 10\right\rangle\) with the right amplitude and phase. We conjecture that the trends in \({J}_{\max }\) and ΔB arise from the same mechanisms for producing a superposition of \(\left\vert 01\right\rangle\) and \(\left\vert 10\right\rangle\) with the correct phase as described for H2.
Finally, in Fig. 7, we observe an \({{\rm{IQ}}}_{\max }\) dependence as transitions will, in general, require single-qubit drives. Further, we conjecture that \({J}_{\max }\) and ΔB dependencies arise from the same mechanisms as for H2.
Device imperfections
In the previous sections, we studied the dependence of METs on the drive parameters of an ideal device. Now, we consider the dependence of METs on device imperfections, which can arise due to the inhomogeneity of a micromagnet. Specifically, we consider off-axis microwave drives and nonlinear spacings of the qubits’ Zeeman splitting.
Off-axis microwave drives
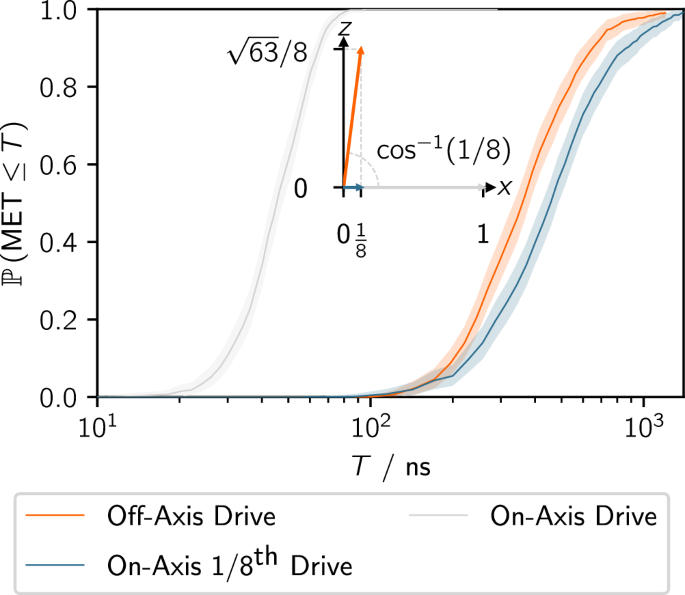
In Eq. (1) we label the quantisation direction as the z-direction and assume the microwave drive is orthogonal and in the x-direction. Device imperfections, e.g. due to inhomogeneities of a micromagnet, may lead to additional drive terms along the y- and z-direction, given as \(-g(t)/2\mathop{\sum }\nolimits_{i = 1}^{N}({\alpha }_{y}^{i}{\hat{\sigma }}_{y}^{(i)}+{\alpha }_{z}^{i}{\hat{\sigma }}_{z}^{(i)})\). To leading order, these y-drives can be removed by adjusting the phases in Eq. (2). Hence, we assume that \({\alpha }_{y}^{i}=0\). Nonetheless, applying a microwave drive may still induce unintended, off-axis drives in the z-direction. To leading order, in the rotating wave approximation, these off-axis drives should neither affect the qubit dynamics nor the METs. To corroborate this hypothesis, we simulate the cumulative METs for random state transitions on a two-qubit system with three variations of the microwave drive. Specifically, the maximal microwave drive amplitude \({{\rm{IQ}}}_{\max }=10/\sqrt{2}\) MHz in the (1, 0, 0) and \((1/8,0,\sqrt{63}/8)\) directions, and \({{\rm{IQ}}}_{\max }=10/(8\sqrt{2})\) MHz in the (1, 0, 0) direction. The corresponding data is depicted in Fig. 8 as (gray, orange, and blue) curves (left to right), respectively. As expected, the MET data obtained for simulations with identical x-drives (orange and blue curves) are almost identical despite the large off-axis z-drive for one of them. Thus, the MET is well predicted by projecting the microwave drive onto the xy-plane. Additionally, as the microwave drive strength is a limiting factor for the MET (see Fig. 7), we expect the MET to be approximately proportional to \({{\rm{IQ}}}_{\max }\cos (\theta )\) where θ is the angle to the xy-plane. This is corroborated by the on-axis drive with 1/8th of the drive strength (gray curve) having METs roughly eight times smaller.
Specifically, the maximal microwave drive amplitude \({{\rm{IQ}}}_{\max }=10/\sqrt{2}\) MHz in the (1, 0, 0) and \((1/8,0,\sqrt{63}/8)\) directions, and \({{\rm{IQ}}}_{\max }=10/(8\sqrt{2})\) MHz in the (1, 0, 0) direction: gray, orange, and blue curves, respectively. The shaded regions correspond to 99.99% confidence intervals. The inset presents the relative magnitude and direction of the maximal microwave drive.
Nonlinear spacings of the qubits’ Zeeman splittings
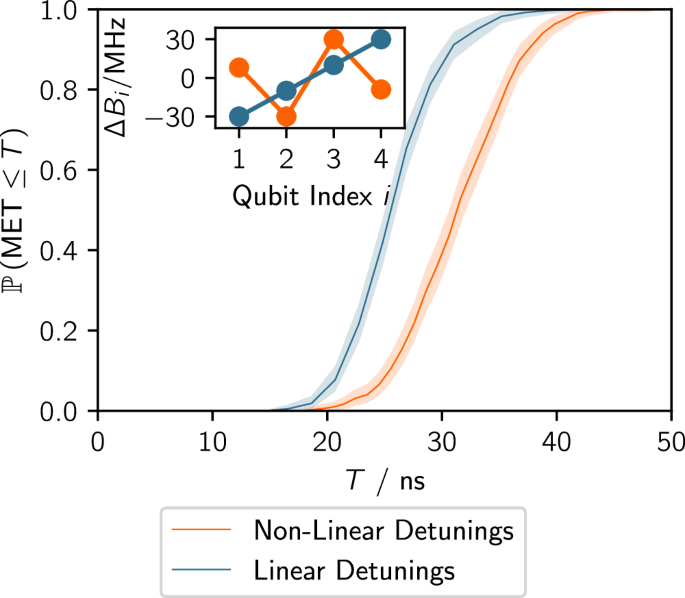
Until now, we have assumed our Zeeman splittings are linearly spaced: Bi+1 − Bi = ΔB. However, this may not be the case due to magnetic imperfections or variations in the g-factor. To demonstrate the robustness of our results to such imperfections, we compare, in Fig. 9, the MET for Haar random state transitions of two four-qubit systems: One with the Zeeman splittings used throughout this article [Bi = 28 GHz + (−30, −10, 10, 30) MHz], and the other with the Zeeman splittings chosen as Bi = 28 GHz + (8, −30, 30, 9) MHz. The METs for both cases are almost identical.
Leakage
In this section, we study the impact of higher-order excited levels of the silicon quantum dots on the evolution of our silicon quantum processor. In general, the two-level subsystems that define the computational subspace cannot be perfectly isolated from the system as a whole. The lack of isolation leads to leakage: population transfer to the non-computational subspace. Leakage is a double-edged sword: On the one hand, leakage decreases fidelities. The loss in fidelity can be mitigated with increased shot count if non-computational measurement results can be discarded9. On the other hand, leakage can accelerate state preparation by exploiting even faster transitions through the non-computational subspace. This has previously been demonstrated for superconducting9 and singlet-triplet qubits56.
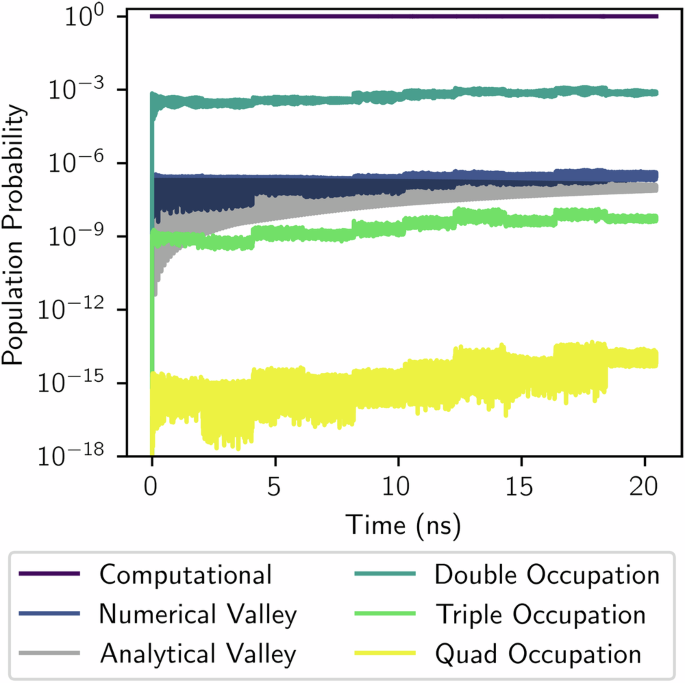
In this study, we will not investigate the possibility of accelerating METs in silicon hardware by exploiting fast transitions through the non-computational subspace. Instead, we consider the impact of leakage on the fidelity of optimal pulses obtained for a Heisenberg model,21 where only the computational subspace is available. To illustrate the effect of leakage, we study the preparation of the ground state of LiH at the equilibrium bond distance of 1.59 Å for a pulse of duration T = MET = 20 ns. First, we construct an optimal pulse by solving for the ground state of LiH within a Heisenberg model, Eq. (1)21. We then quantify the leakage by evolving the optimal pulse of the Heisenberg model in an extended Hubbard model,21 which contains both valley states (arising from the degenerate minima in the silicon conduction band structure)20 and multi-electron occupation. See Supplementary Note 8 for details of the model and device parameters41,57,58,59,60,61,62,63. The results for a SiMOS device (where valley states are energetically well separated from the computational subspace) are shown in Fig. 10. The figure depicts the probability of occupying certain subspaces as a function of time. The subspace associated with two electrons occupying a single quantum dot, i.e., the double occupation subspace, is the dominant leakage channel, with a population probability of ≈10−3. It is followed by leakage to the valley states, with a population probability of ≈10−6. The triple-occupation and quadruple-occupation subspaces have smaller population probabilities of ≈10−9 and ≈10−10, respectively. Further, we found the relative energy error due to leakage, [Cleakage(T) − C(T)]/C(T), to be 7 × 10⁻³. This can be reduced further to 4 × 10⁻⁴ by projecting the final state onto the computation subspace and renormalizing. We note that pulse optimization in the presence of leakage should reduce the error even further. Overall, these results confirm that leakage is of little detriment to METs on small electron silicon quantum processors. For results on Si/SiGe devices in the presence of valley hotspots60,61 see Supplementary Note 8.
Curves show the probability of occupying the computational, valley, double-, triple-, and quadruple-occupation subspaces of a 4-site Hubbard model with valleys. The applied pulse achieves the ground-state of LiH at the equilibrium bound distance of 1.59 Å in the corresponding 4-spin Heisenberg model21 within 20 ns.
