I started using Monarch to track my expenses in December 2023, which is why my data starts at that point.
I'm a single male, 40 years old, living in the Minneapolis, MN area. All these expenses are for me only; I have no other mouths I'm feeding.
The caveat for "groceries" is that this includes everything I buy at a grocery store which is occasionally NOT food, so things like laundry detergent, general toiletries like soap and toothpaste, etc. I would estimate those comprise about 10-15% of my "grocery" budget.
My current BMI is 21.4. I'm also an avid runner and log probably about 10ish miles a week.
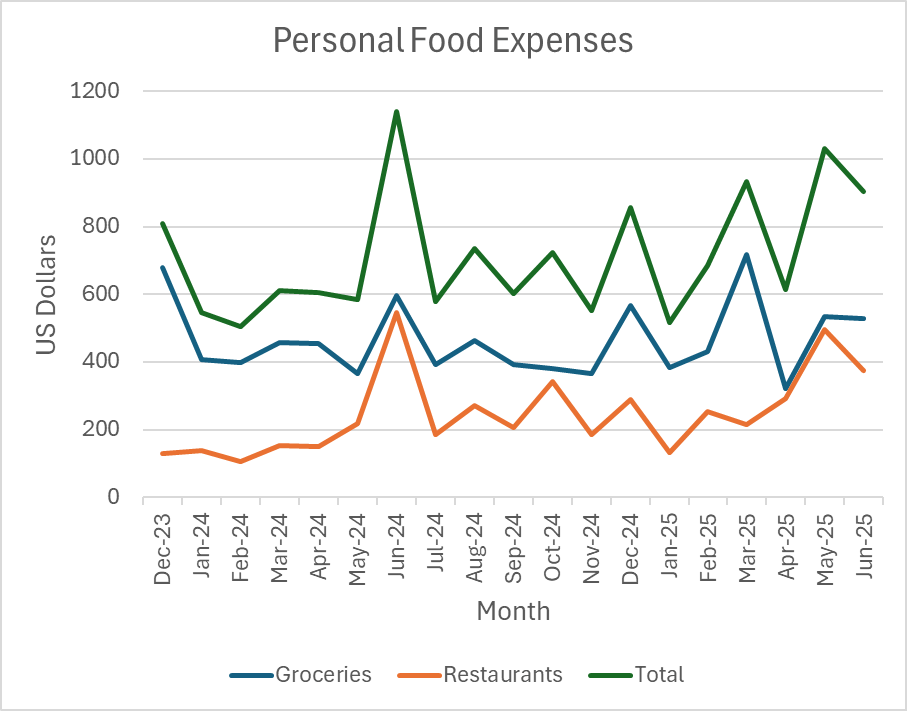
In June 2024, I was at a conference in Philadelphia for four days and ate a LOT. This included numerous trips to Reading Terminal Market where I also bought plenty of treats I brought home for others. I believe I classified some of my Reading Terminal Market expenses as "groceries". Then, later that month, there was a food truck festival in my hometown, at which I ate like a complete slob, I'm sure.
As for May 2025, I was in Carolina Beach for end of April / beginning of May and I suppose more of the expenses showed up in May. It was only a four-day trip, though, and my eating patterns were otherwise pretty standard for the month, as far as I can tell.
Posted by Nillavuh
6 comments
Also, I used excel to generate this, which is probably obvious. Sorry I don’t have access to anything cooler than that :S
what happens in may every year?
I understand restaurants going up when you were on your little vacation, but 200 bucks for groceries in four days? I would assume that the orange line would eclipse the blue line here.
Is this made by using streamlit?
My average over the same time period as a single 29 y/o man in America is $313 for groceries and $251 for restaurants; $564 total.
Stacked area chats can also look nice … and they can be more insightful than just layering data series in a line chart.
Comments are closed.