Quick overview
Gold (XAU/USD) ended last week flat, trading near $3,336, as markets digested a string of economic reports and awaited major catalysts ahead. While the U.S. jobs report offered mixed signals, gold’s price action has remained tightly coiled, hovering above a critical support zone at $3,323.
In the week ahead, the spotlight will be on the U.S. FOMC meeting minutes, which are due on Wednesday. At the same time, fresh unemployment claims are due on Thursday.
With U.S. inflation concerns easing slightly and economic data showing signs of a slowdown, gold bulls are watching for any signs of a dovish pivot in the Fed’s tone.
Key Data Recap: Mixed Signals for the Fed
Last week’s U.S. data painted a complicated picture:
Non-Farm Payrolls: 147K vs. 111K forecast — stronger than expected
Unemployment Rate: Fell to 4.1% from 4.2%
ISM Services PMI: Rebounded to 50.8, beating last month’s 49.9
Factory Orders: Surged 8.2% after a -3.9% dip previously
Even if U.S. labour released solid jobs figures, wage growth slowed to 0.2%, easing inflation fears. This helps explain gold’s tight range, as traders weigh slowing momentum against a still-hawkish Fed.
Looking ahead:
July 9: FOMC Meeting Minutes
July 10: Weekly jobless claims and Fed official Waller’s speech
These events could shape market expectations for a possible September rate cut — or delay it altogether.
GOLD
Gold Technicals: Compression Near Support Zone
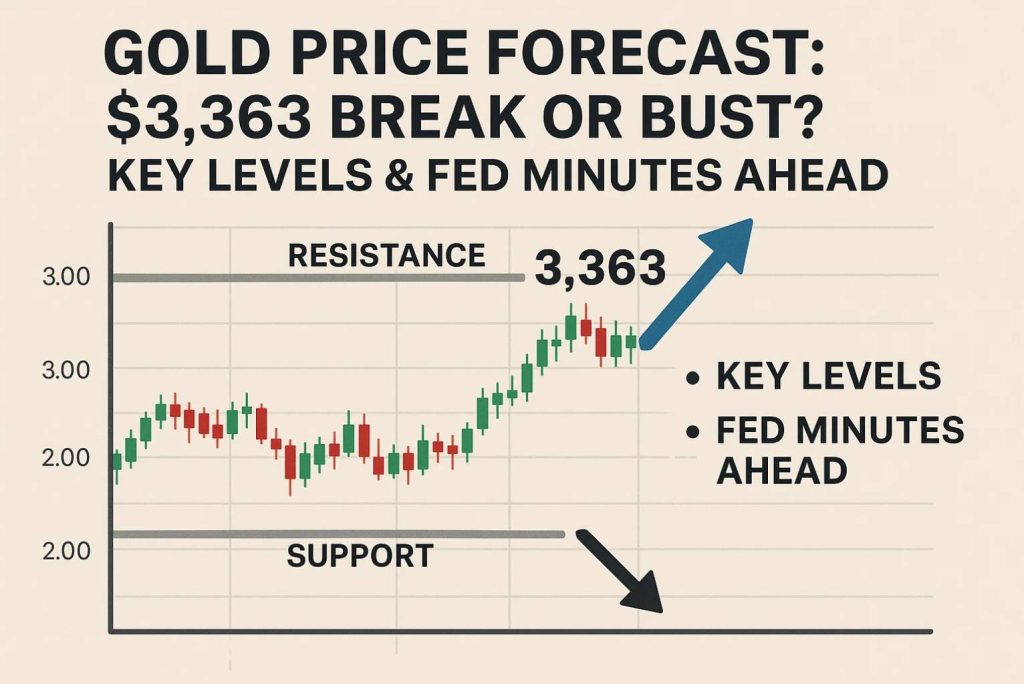
Gold’s technical outlook remains neutral-to-bullish, but it is tightly squeezed. Price is stuck between a rising trendline from the June 29 low and resistance at $3,363. Small-bodied candles and spinning tops indicate indecision, while the 50-SMA ($3,323) and 100-SMA ($3,353) act as short-term boundaries.
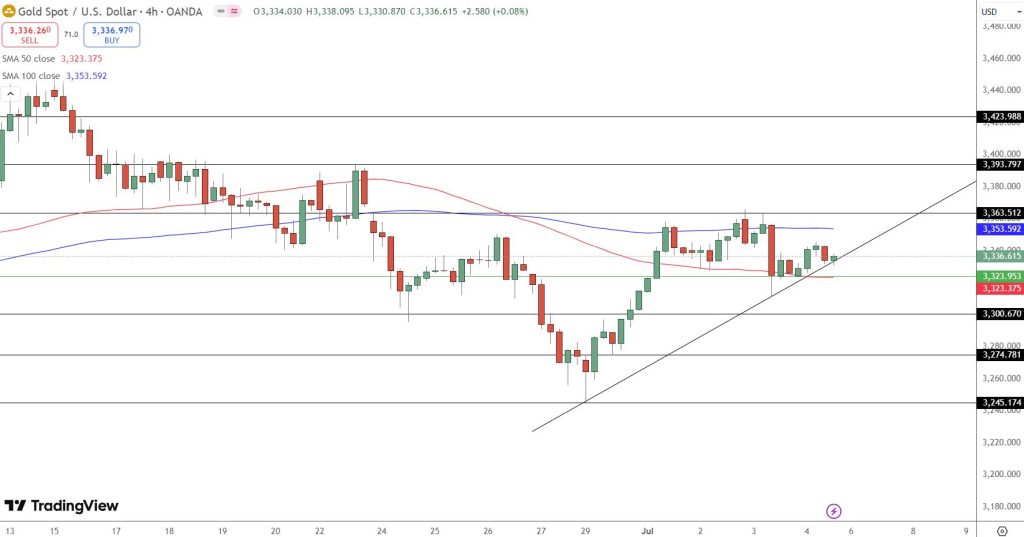
Gold Price Chart – Source: Tradingview
Key Levels to Watch:
Resistance: $3,363, $3,393, $3,423
Support: $3,323, $3,300, $3,274
Trendline: Still rising — a key signal for bullish continuation
A clean break above $3,363 with volume could unlock further upside. On the flip side, a close below $3,323 would expose gold to a pullback toward $3,300 or lower.
Trade Idea: “Compression Break” Setup
Traders watching for a breakout should wait for clear confirmation. The chart suggests gold is nearing a decision point.
Entry Zone: Above $3,340 with a bullish candle
Targets: $3,363 → $3,393
Stop-Loss: Below $3,320
Bias: Neutral-to-bullish while above trendline
This is a “watch and wait” scenario. If Fed minutes hint at easing policy later this year, gold could reclaim momentum. If not, brace for potential downside.
Arslan Butt
Lead Markets Analyst – Multi-Asset (FX, Commodities, Crypto)
Arslan Butt serves as the Lead Commodities and Indices Analyst, bringing a wealth of expertise to the field. With an MBA in Behavioral Finance and active progress towards a Ph.D., Arslan possesses a deep understanding of market dynamics.
His professional journey includes a significant role as a senior analyst at a leading brokerage firm, complementing his extensive experience as a market analyst and day trader. Adept in educating others, Arslan has a commendable track record as an instructor and public speaker.
His incisive analyses, particularly within the realms of cryptocurrency and forex markets, are showcased across esteemed financial publications such as ForexCrunch, InsideBitcoins, and EconomyWatch, solidifying his reputation in the financial community.
Related Articles