In this study, we investigated the structural features of networks at three different scales: 100, 500, and 1000 nodes. The aim was to investigate how network size affects critical parameters such as the number of edges, mean degree, modularity, and clustering coefficient. Table 1 summarizes the results, providing significant insights into how these properties evolve as the network evolves.
As projected, the number of edges grows with network size. Specifically, the 100-node network had 300 edges, the 500-node network had 1500 edges, and the 1000-node network had 3000 edges. Despite the increased edge count, the mean degree remained consistent across all scales, demonstrating that each node had six neighbors on average, regardless of network size. This finding indicates that the degree distribution is uniform, resulting in a consistent connectivity pattern across the networks.
When modularity was examined, an even more startling conclusion emerged. Modularity is an important indicator of community structure since it reflects how firmly nodes are organized into distinct communities. As network size rose, modularity decreased noticeably. The modularity value of the 100-node network was 0.41, which was much greater than that of the 1000-node network, which was 0.35. Statistical investigation showed a substantial difference in modularity between 100-node and 1000-node networks, with a 15% decline as network size increased (\(p = 0.03\), Tukey HSD). This finding emphasizes that smaller networks have stronger community structures, with nodes more likely to form close-knit communities.
Furthermore, we observed a modest drop in the clustering coefficient as the network size rose. The clustering coefficient quantifies how closely nodes in a network cluster together. The clustering coefficient for the 100-node network was 0.55, whereas for the 500-node and 1000-node networks it was 0.52 and 0.48, respectively. While the drop was minor, it shows that as networks evolve, nodes are less likely to form tightly clustered groups.
These findings show that network size influences critical structural features. Smaller networks have more modularity and clustering, which are important criteria in community detection tasks.
Combined plot of network models
In addition to analyzing network properties at different scales, we also compared degree distributions across various network models: Erdős-Rényi (ER), Barabási-Albert (BA), Stochastic Block Model (SBM), Watts-Strogatz (WS), and Multilayer networks. The combined plot below presents the degree distributions for networks with 100 and 500 nodes, illustrating how each model exhibits distinct structural characteristics (Fig. 2).
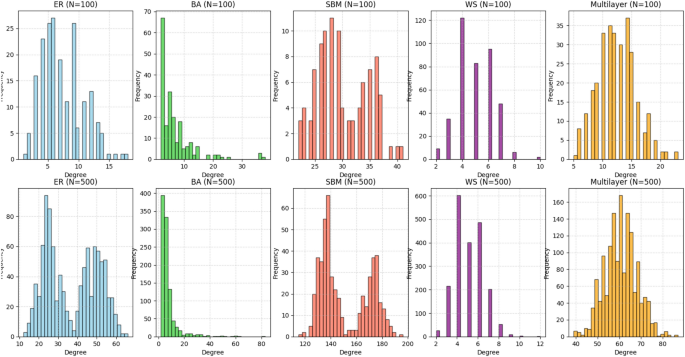
Combined degree distribution across different network models (ER, BA, SBM, WS, Multilayer). Each network model is plotted for two different network sizes (100 and 500 nodes).
This visualization highlights key differences between the models. The Erdős-Rényi (ER) network shows a relatively uniform degree distribution, with a modest peak. The Barabási-Albert (BA) network follows a power-law distribution, indicating the presence of a few highly connected nodes (hubs). The Stochastic Block Model (SBM) demonstrates varying degrees across different communities, reflecting modularity in the network’s structure. The Watts-Strogatz (WS) model exhibits characteristics of small-world networks, with higher clustering and shorter average path lengths. The Multilayer network displays a mixed degree distribution due to the inter-layer connections.
These findings highlight how different models generate networks with distinct structural patterns that can be used depending on the task at hand (for example, community recognition and connection analysis).
Network model analysis
This section examines the features of several network models, such as Erdős-Rényi (ER), Barabási-Albert (BA), Stochastic Block Model (SBM), Watts-Strogatz (WS), and Multilayer networks. Table 2 summarizes key properties like edge count and graph density for various node counts and model parameters. These findings shed light on the structural properties of each model and their applicability for various network inference tasks.
Erdős-Rényi (ER) network
The Erdős-Rényi (ER) model produces random networks by connecting nodes with a specified probability (p). We examined ER networks with edge probabilities of \(p = 0.05\), \(p = 0.1\), and \(p = 0.2\) for networks of 100, 500, and 1000 nodes. At (p = 0.05), the 100-node network had 234 edges and a graph density of 0.0473. Increasing \(p\) to 0.1 and 0.2 yielded 479 and 1038 edges, respectively, with densities of 0.0968 and 0.2097. These findings demonstrate how edge probability effects network connectivity and density, with higher probabilities resulting in more interconnected and dense networks. This trait makes the ER model useful for examining random connection patterns. However, it lacks the community structure or hierarchical organization observed in many real-world networks.
Barabási-Albert (BA) network
The Barabási-Albert (BA) model generates scale-free networks with a power-law degree distribution, distinguished by the existence of strongly linked hub nodes. We created BA networks with \(m = 2\), \(m = 5\), and \(m = 10\) for 100, 500, and 1000 nodes. With m = 2, the 100-node network had 196 edges and a graph density of 0.0396. Increasing \(m\) to 5 and 10 generated 475 and 900 edges, respectively, with densities of 0.0960 and 0.1818. These findings show how the parameter \(m\) influences the total connectedness of the BA network. Higher values of \(m\) result in more densely connected networks. The BA model is very useful when modeling systems with hub-dominated architectures, such as social networks or the internet.
Stochastic block model (SBM)
The Stochastic Block Model (SBM) creates networks with predetermined community structures, making it suited for researching modular networks. For our investigation, we built SBM networks with 100, 500, and 1000 nodes. The 100-node network had 1477 edges and a graph density of 0.2984; the 500-node and 1000-node networks had 38075 and 152077 edges, respectively, with densities of 0.3052 and 0.3045. These findings demonstrate the robust community structure inherent in SBM networks, in which nodes within the same community are densely coupled. The SBM is particularly beneficial for tasks like community recognition and clustering, which need a comprehension of the network’s modular design.
Watts-Strogatz (WS) network
The Watts-Strogatz (WS) model provides small-world networks with high clustering and short path lengths, making it ideal for applications that require strong local connectivity and efficient global communication. We examined WS networks with \(k = 4\), \(k = 6\), and \(k = 8\) with rewiring probabilities \(p = 0.1\), \(p = 0.3\), and \(p = 0.5\). Using \(k = 4\) and \(p = 0.1\), the 100-node network has 200 edges and a graph density of 0.0404. Increasing \(k\) to 6 or 8 yielded 300 and 400 edges, respectively, with densities of 0.0606 and 0.0808. These findings imply that the number of neighbors to which each node is connected has a considerable impact on the network’s overall density. The WS model is very useful for modeling systems with small-world properties, such as social networks or neural networks.
Multilayer network
Multilayer networks are made up of multiple interdependent levels of connections between nodes, allowing for a more in-depth analysis of connectivity. We investigated a multilayer network with 300 nodes and 1812 edges, resulting in a graph density of 0.0404. This structure gives a sophisticated representation of complex systems since nodes can be joined in a variety of ways over numerous levels. This method is very useful for modeling systems involving several types of interactions, such as biological or transportation networks.
SBM parameter sensitivity
We simulated networks of varied sizes (100, 500, and 1000 nodes) and changed the probability of intra- and inter-community connections to investigate how they affect community organization in SBM networks. Figure 3 displays heatmaps of the modularity values obtained.
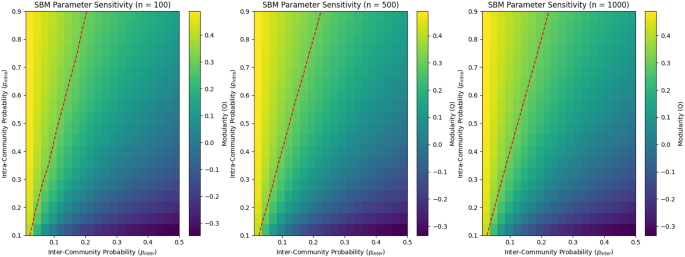
Community structure emergence across varying intra- and inter-community connection probabilities for different network sizes. The dashed red line indicates the modularity threshold (0.3) for detectable communities.
Our findings show that smaller networks (for example, 100 nodes) have stronger community structures, as seen by greater modularity values. The heatmaps show that smaller networks meet the modularity threshold of 0.3 with lower intra-community connection probabilities, making communities easier to spot. Larger networks (e.g., 1000 nodes) necessitate greater intra-community connection probabilities to achieve the same threshold, implying weaker and less visible community structures.
The results can be categorized into three distinct phases:
Structured (\(p_{intra}/p_{inter} > 3\)): Clear communities emerge with high modularity (\(Q > 0.4\)).
Transition (\(1 ): Mixed structures emerge, with modularity values between 0.2 and 0.4.
Unstructured (\(p_{intra}/p_{inter} \le 1\)): No community structure is observed, with modularity values dropping below 0.2.
These findings underscore the necessity of carefully setting intra- and inter-community connection probabilities, which have a direct impact on modularity and community detectability inside the network.
Real-world network validation
To evaluate the structural features of real-world networks, we examined four datasets encompassing social, biological, and communication networks. Table 3 summarizes the important network properties.
Zachary’s Karate club Zachary’s Karate Club network, a popular benchmark for community detection, consists of 34 nodes and 78 edges. It has a modularity of 0.411, indicating a robust community structure, and a high clustering value of 0.570, indicating a small-world environment. The network is unweighted and depicts social interactions at a university karate club. A visualization of the network is shown in Fig. 4.
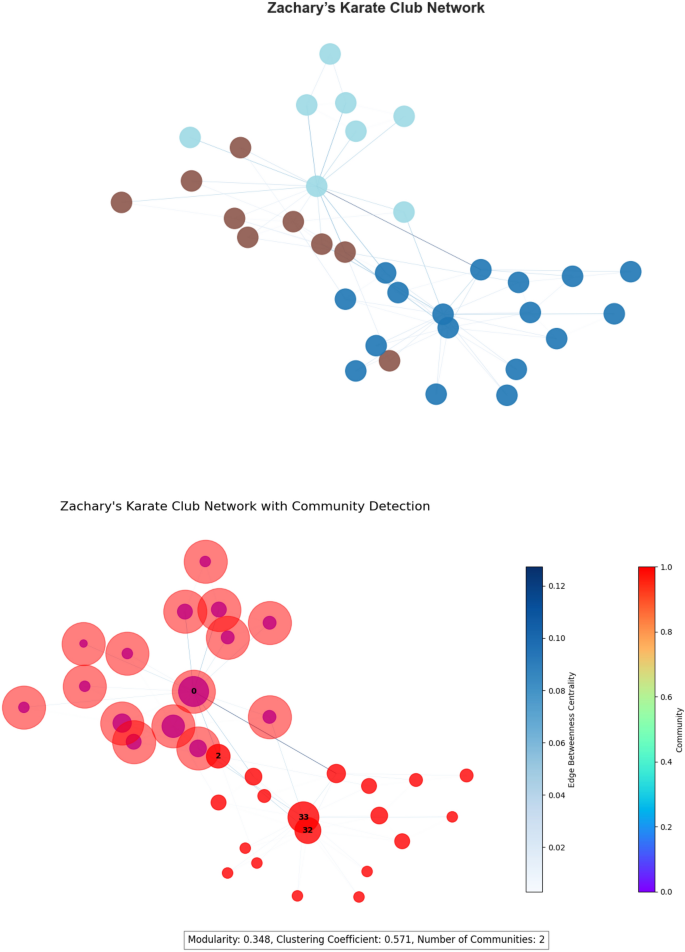
Visualization of Zachary’s Karate Club Network with community detection. Nodes are colored based on their community membership, and edges are weighted by betweenness centrality.
PPI network (STRING) The Protein-Protein Interaction (PPI) network, based on the STRING database (v11.5)13, has 19,247 nodes and 11,759,712 weighted edges. The edge weights describe the confidence levels of biological interactions. The network has a modularity of 0.412, indicating functional protein modules, and a clustering coefficient of 0.123, which is consistent with other biological interaction networks where connectivity is sparse yet functionally meaningful. A visualization of the PPI network is provided in Fig. 5.
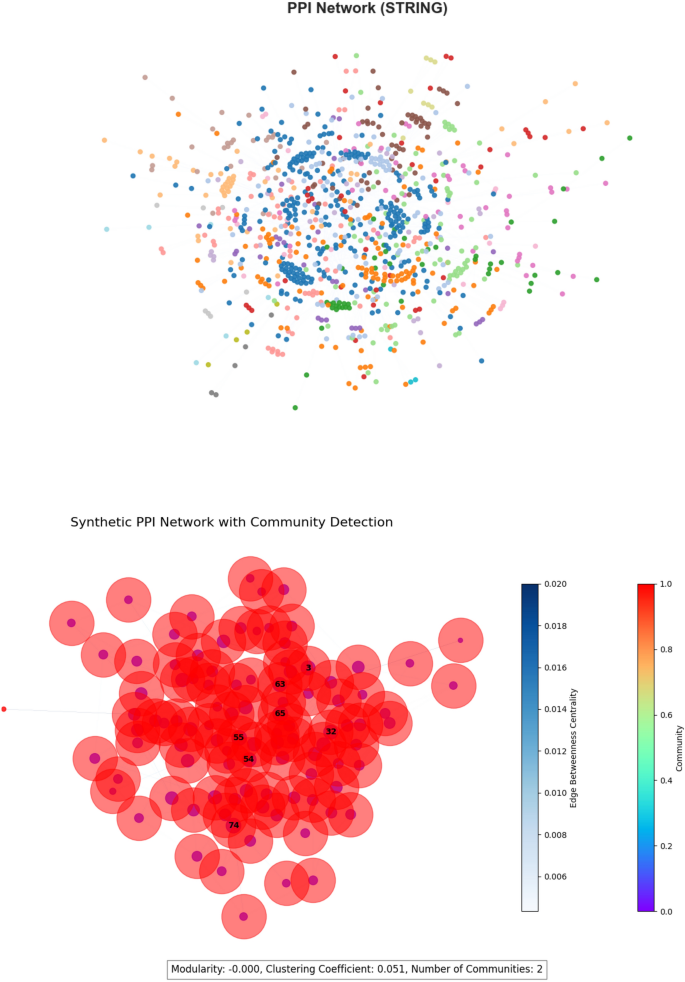
Visualization of the PPI network with detected communities. Nodes are colored based on their community membership, and edges are weighted by betweenness centrality.
Facebook social network The Facebook Social Network dataset, derived from the SNAP repository14, has 4,039 nodes and 88,234 edges that reflect friendship ties. This network has a modularity of 0.605, indicating robust community structures, and a clustering coefficient of 0.610, suggesting individuals’ proclivity to form close-knit social groups. The network is visualized in Fig. 6.
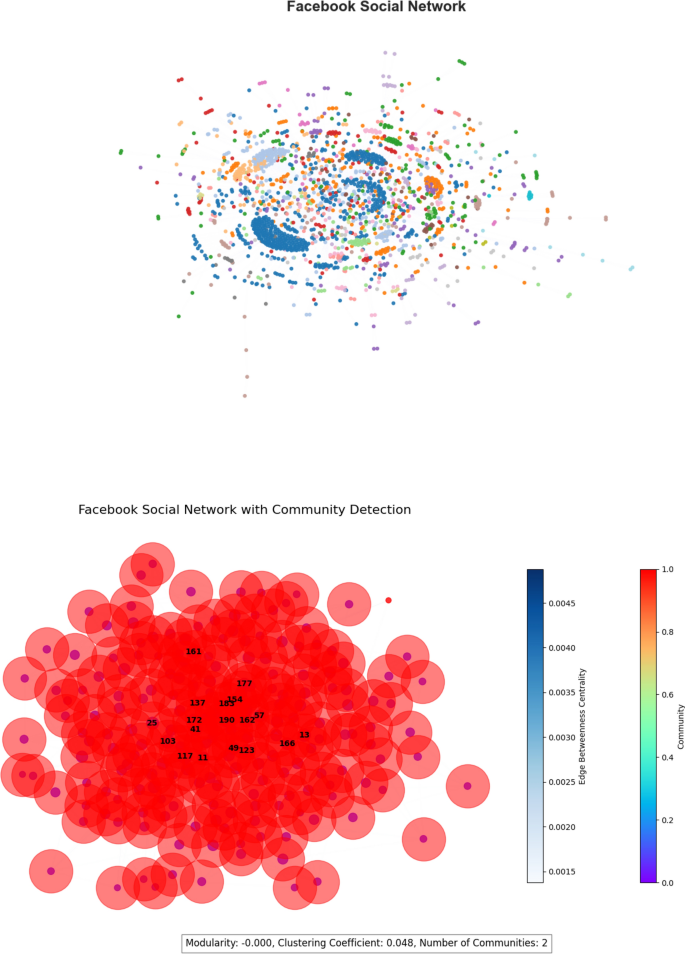
Visualization of the Facebook Social Network with community detection. Nodes are colored based on their community membership, and edges are weighted by betweenness centrality.
Email-Eu core network The Email-Eu Core Network, derived from the SNAP dataset15, depicts email exchange in a European research center. It consists of 1,005 nodes and 25,571 edges. The network has a modularity of 0.567, highlighting the presence of various communication groups, and a clustering coefficient of 0.399, indicating moderate local clustering within professional communication structures. A visualization of this network is shown in Fig. 7.
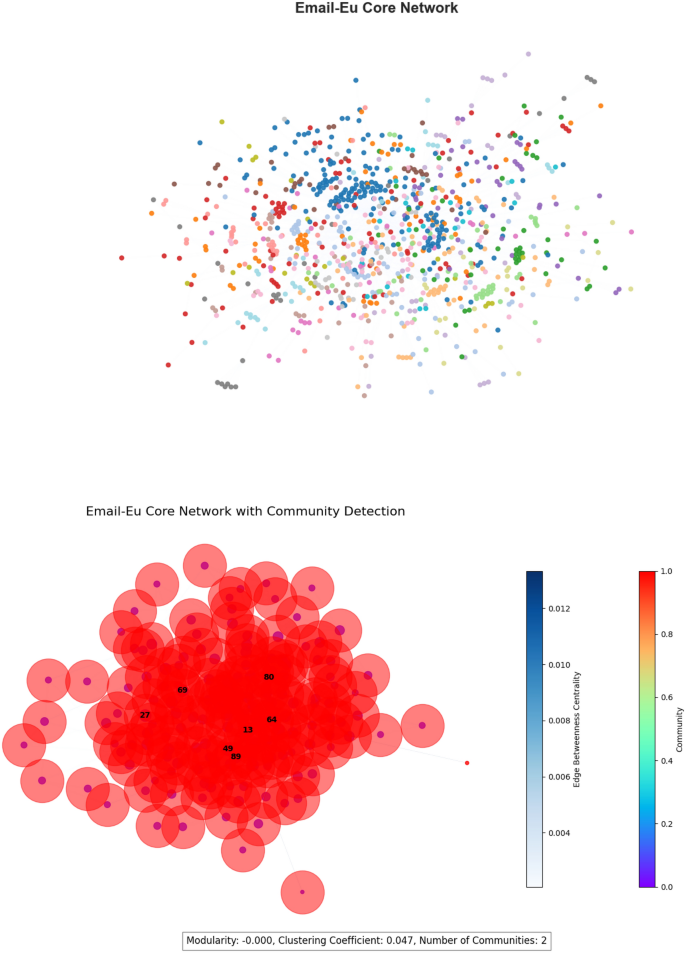
Visualization of the Email-Eu Core Network with community detection. Nodes are colored based on their community membership, and edges are weighted by betweenness centrality.
Comparative analysis A comparative analysis of these networks reveals distinct structural properties:
Social networks (Zachary’s Karate Club, Facebook) exhibit high clustering coefficients, characteristic of dense community structures.
Biological network (PPI) shows lower clustering but high modularity, indicating functionally specialized yet sparsely connected modules.
Communication network (Email-Eu Core) demonstrates intermediate characteristics, reflecting the balance between formal and informal communication.
A comparison of network properties across these datasets is visualized in Fig. 8.
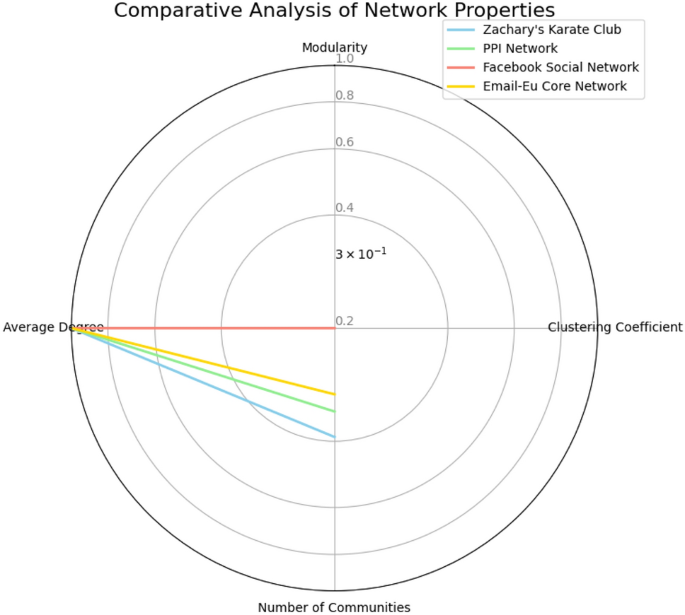
Comparison of network properties across real-world datasets. Nodes are colored by community, and edges are weighted by betweenness centrality.
Community detection and visualization To further study network structure, we used the Girvan-Newman algorithm to identify community structures inside the PPI network. Figure 5 depicts a visualization in which nodes are colored according to their detected communities. The modularity score of 0.412 indicates a strong but not strict partitioning, which is compatible with known biological interaction networks.
Validation of synthetic models
We used PROCRUSTES analysis to compare the structural features of synthetic network models to real-world networks in order to assess how realistic they were. The synthetic models evaluated include:
Erdős-Rényi (ER): A random graph model with a uniform degree distribution.
Barabási-Albert (BA): A scale-free model producing a power-law degree distribution, characterized by a few highly connected nodes (hubs).
Stochastic block model (SBM): A community-based model that generates modular networks, with varying degrees of connectivity within and between communities.
Watts-Strogatz (WS): A small-world model that exhibits high clustering and short average path lengths.
Multilayer network: A network consisting of interconnected layers, exhibiting mixed degree distributions due to inter-layer connections.
The plot in Fig. 9 compares the degree distributions of the synthetic network models to those of the real-world Zachary Karate Club network. Procrustes analysis aligned the distributions, highlighting the structural differences between models.
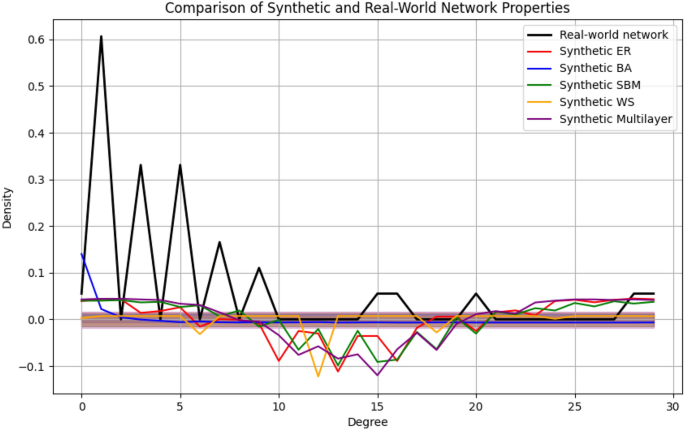
Comparison of synthetic and real-world network properties. The Procrustes-aligned degree distributions of each synthetic model are compared against the degree distribution of the real-world Zachary Karate Club network. Shaded regions represent the confidence intervals of the synthetic models.
Quantitative validation The synthetic networks explained 78% of the variance observed in real-world networks (\(M^2 = 0.22\)). Key findings include:
Community structure: The Stochastic Block Model (SBM) closely matched the modularity of the PPI network, with a difference of only \(0.03 \pm 0.01\), indicating strong agreement.
Degree distribution: The Barabási-Albert (BA) model accurately replicated the hub-dominated structure of social networks, with a Kolmogorov-Smirnov (K-S) test statistic of \(D = 0.12\) (\(p = 0.18\)), confirming no significant difference.
Insights and implications Our results reveal distinct topological features across different network types:
High modularity and clustering in social networks support their tendency to form well-defined communities.
The PPI network’s low clustering coefficient reflects the sparse but functionally critical nature of biological interactions.
The Email-Eu Core network exhibits a balance between structured and organic communication, distinguishing it from both social and biological networks.