Forty-nine wells penetrating the reservoir across the four fields were selected for the current study, generating 51 PVT datapoints from in-situ representative downhole or recombined wellstream composition samples that generated reliable gas-oil ratios and phase envelopes.
Current basin models
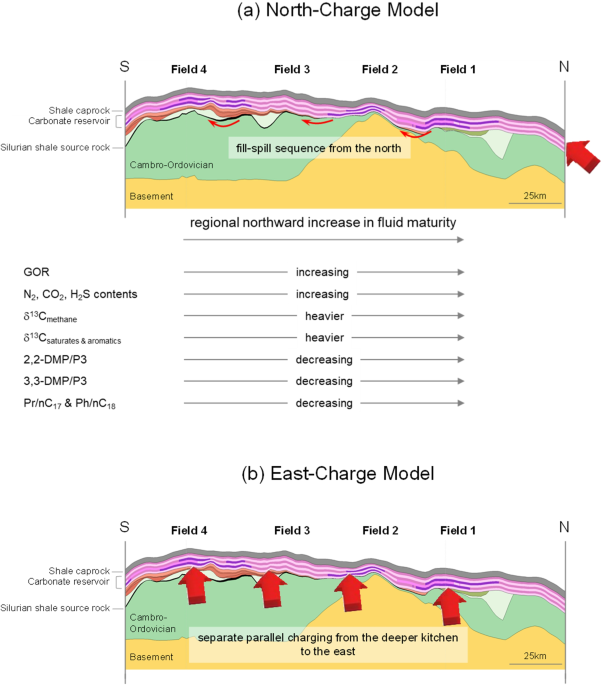
Collective geochemical evidence previously collectively used to support the north-charge model, as summarized in Fig. 1a, includes the regional northward increase in gas maturity as indicated by heavier carbon isotopic compositions, decreasing trends for pristane/n-C17, phytane/n-C18 and various light hydrocarbon molecular ratios (such as 2,2-DMP/P3 and 3,3-DMP/P3), concomitant with an increase in gas-oil ratio (GOR), CO2 and nitrogen contents7,8. However, migration of hydrocarbons from the north to Field 1, then all the way to Field 4 in the south is highly unlikely, considering mass-balance calculations (size of the presumed kitchen versus size of fields) and inaccessibility to charge from a northern source kitchen, as revealed by modeling such migration scenarios. Additionally, a single migration pathway will inevitably suffer significant hydrocarbon losses en route, and cannot account for the large amounts of hydrocarbons accumulated across multiple Paleozoic reservoirs.
Our current basin model, constrained by fluid inclusion microthermometry (unpublished), suggests charging from the east during the Early to Late Cretaceous times, peaking at around 100 Ma, with only subordinate contributions from the north and south. This east-charging model, a time-snap of which at 100 Ma is shown in Fig. 2, suggests that Field 1 was charged first, mainly from the deeper (northern) portion of the kitchen immediately to the east, with generation subsequently progressing from the increasingly shallower and less-mature portions of the kitchen to the south, successively charging the different areas via numerous parallel migration pathways, marked in red in Fig. 2. In other words, the different areas received separate charges from the east, mainly via carrier beds, supplemented in some areas by fault migration, as discussed in the following sections. This east-charging model reflects the best overall fit to calibration data and geological interpretation. The model has been validated under multiple scenarios including various depth conversion models (assuming different geometries), multiple source-rock variations (e.g., facies distribution and amount of organic content) and regional reservoir/seal relationships (testing petrophysical datasets).
Regional trends in reservoir-fluid properties in relation to geochemical trends
The GOR generally increases towards the north, concomitant with a decrease in the heptane-plus fraction in reservoir fluids (Fig. 3). Reported northward geochemical trends are summarized in Fig. 1a. These include isotopically heavier carbon isotope (C-13) composition of gas, saturate and aromatic fractions, decreasing pristane/n-C17 and phytane/n-C18 ratios, and systematic variations in the C7 compounds and light hydrocarbon molecular ratios8. Together with the increasing nitrogen content and earlier fluid-inclusion entrapment, these data collectively indicate that fluids in Field 4 have the lowest thermal maturity and those from Field 1 the highest maturity7,8. The inferred trend of fluid maturity parallels that of source-rock maturity, as reported previously8 and modeled here (Fig. 2). Although such geochemical trends may instigate a single southward long-range migration scenario, accessibility to additional data, including PVT tests, has allowed further scrutiny of migration models, in favor of a predominantly east-charging scenario. Observed general trends of decreasing fluid maturity and sequentially charging the north first then progressively the south is interpreted here to be caused by multiple westward migration pathways from an east-lying kitchen that successively decreases in maturity to the south rather than a single southward fill-spill setting, as discussed below.
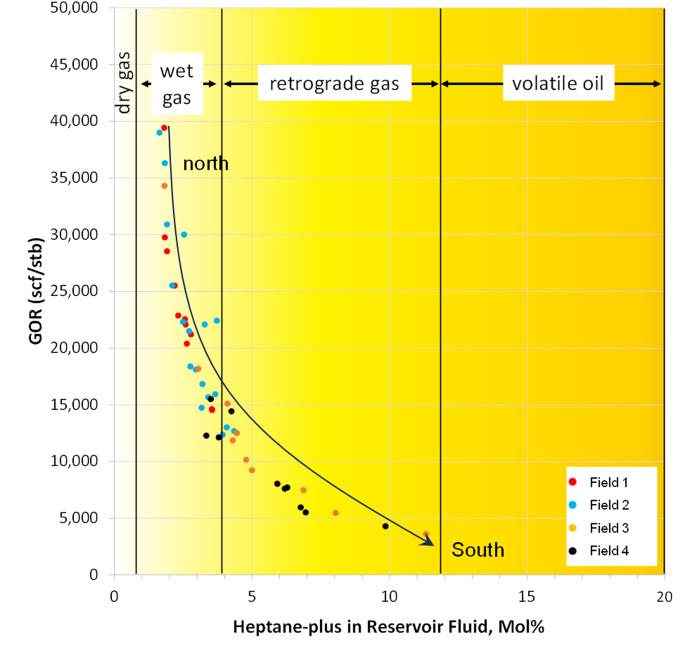
General decrease in gas-oil ratio (GOR) towards the south, concomitant with a systematic drop in the heptane-plus (C7+) fraction.
Fluid alteration
Before attempting to extract maturity parameters from PVT fluid composition such as the volatile light hydrocarbons (VLH), it is important to assess the level of alteration reservoir fluids have suffered16. This is because alteration processes, like biodegradation, water washing, and thermochemical sulfate reduction (TSR), modify or—in extreme cases—obliterate the original charge composition and render its maturity estimation inaccurate. In our previous study to investigate the behaviour of VLH in a wide range of oil and gas fields under varied geological conditions across the Arabian Plate we included a subset of samples from 15 wells from the current study area16. Reservoir fluids are H2S-free in the shallower south (Field 4), becoming increasingly sour at the expense of hydrocarbons (CaSO4 + CH4 → CaCO3 + H2S + H2O) with increasing depth and temperature towards the north due to TSR (Fig. 4a and b). This dependence explains the reverse relationship between the H2S and total hydrocarbon content shown in Fig. 4c, and the increase in gas acidity (higher content of H2S, nitrogen and carbon dioxide) as TSR intensifies16. The sulfur isotope ratio (δ34S) for the H2S varies between + 4 and + 9‰, closely matching that of the associated anhydrite layers (+ 9 to + 11‰) and confirming the TSR origin for the hydrogen sulfide8. A minimum subsurface temperature range of 100–140 °C is required for significant TSR17depending on multiple factors such as fluid composition and the nature of anhydrite, among other factors17,18,19,20. Here, a temperature around 270 °F (132 °C) appears to be the threshold for TSR and subsequent generation of H2S, which increases up to about 29 mol% at greater depths and temperatures in Field 2. It is interesting to note that the downdip sections in Field 2, as well as Field 1 (except for one sample near the northern tip), record no H2S. Deeper sweet gas could represent more recent charges or remigration from deeper sweet-gas reservoirs. In contrast, sour fluids above the depth and temperature thresholds could be due to the presence of reactive finely crystalline anhydrite known to initiate the TSR reaction at lower temperatures18or could represent remigrated fluids from deeper, previously altered, sections.
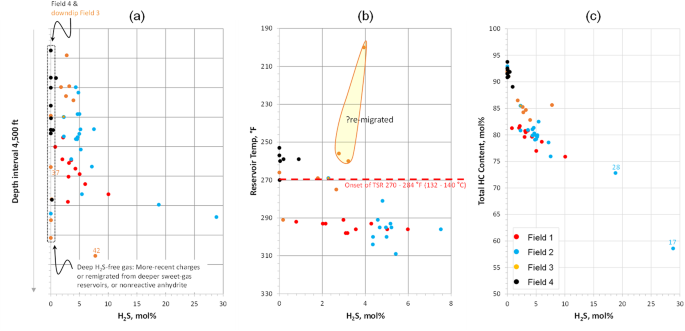
The H2S increase with (a) depth, and (b) temperature, due to intensifying thermochemical sulfate reduction (TSR) in the deeper/hotter reservoir intervals. The TSR consumes hydrocarbons, leading to the formation of H2S at the expense of hydrocarbons, which explains the reverse relationship between H2S and total hydrocarbon content (c).
Among fluid constituents altered by TSR are the VLH distributions, leading to reduction in their slope factors (SF), thereby underestimating derived vitrinite reflectance equivalents (%VRe = 0.38 SF + 0.41). The isomer ratios of butane and pentane were, however, reported to be less affected by TSR alteration, and, therefore, their derived %VRe estimates are used in the current study to assess fluid maturity, following respective formulas: %VRe(i4) = 1.70 (iC4/nC4) + 0.61, and %VRe(i5) = 0.89 (iC5/nC5) + 0.56. Fluid maturities together with relationships of condensate-gas ratio (CGR) and saturation pressures (Psat) are key parameters to test the two charge models discussed here. Although TSR may introduce a degree of uncertainty in assessing thermal maturity, the calculated vitrinite reflectance equivalents, discussed below, correspond well with GOR and fluid types as defined based on phase behaviour and generation kinetics of the inferred Silurian marine hot-shale source-rock13,21.
Fluid maturity
Figure 5a shows the crossplot of the two maturity parameters iC4/nC4 and iC5/nC5 for reservoir fluids, while Fig. 5b shows the crossplot of their respective %VRe values. The average estimated maturity range of 1.3 ~ 1.7%VRe is consistent with fluid phases (gas condensate – wet gas) identified based on bulk data like GOR and heptane-plus fractions (Fig. 3). Fluid maturity generally increases to the north, but with significant overlap among the different accumulations (Fig. 6a). While fluid maturity in the shallower south (Fields 3 and 4) extends to the lower end of the maturity range, the overlap negates a single fill-spill relationship, and, instead, favors separate parallel charging from an expansive variably matured kitchen located to the east. The more-mature portions of the deeper kitchen in the north started generating hydrocarbons earlier, hence charging lighter fluids of higher maturity into the northern fields. With time and increased maturity, charging from the shallower portions of the kitchen followed, successively charging areas to the south with fluids of lower maturities, as presented schematically in Fig. 6b. Lack of clear cuts in maturity (and GOR) ranges does not favor a single fill-spill across the area from the deeper north (Fig. 6c). Notable here is that the highest maturities generally occur in wells along the eastern flanks of all fields (labelled in red on the fault map in Fig. 9). These highest maturity/GOR spots could represent entry points, recording the most recent charges that have not yet equilibrated with previous charges. Lack of hydrogen sulfide in these wells at depths greater than the TSR threshold supports this inference (Fig. 4a).
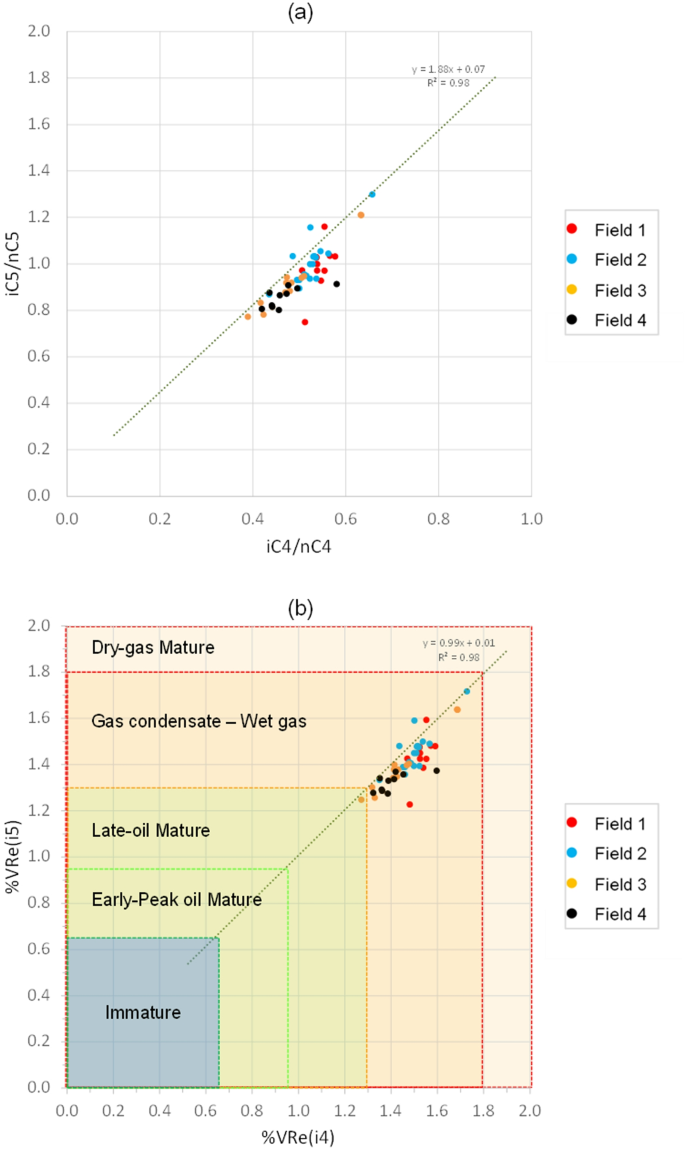
Thermal maturity scheme proposed for the TSR-altered reservoir fluids using the isomer ratios of butane and pentane (after Arouri, 2024).
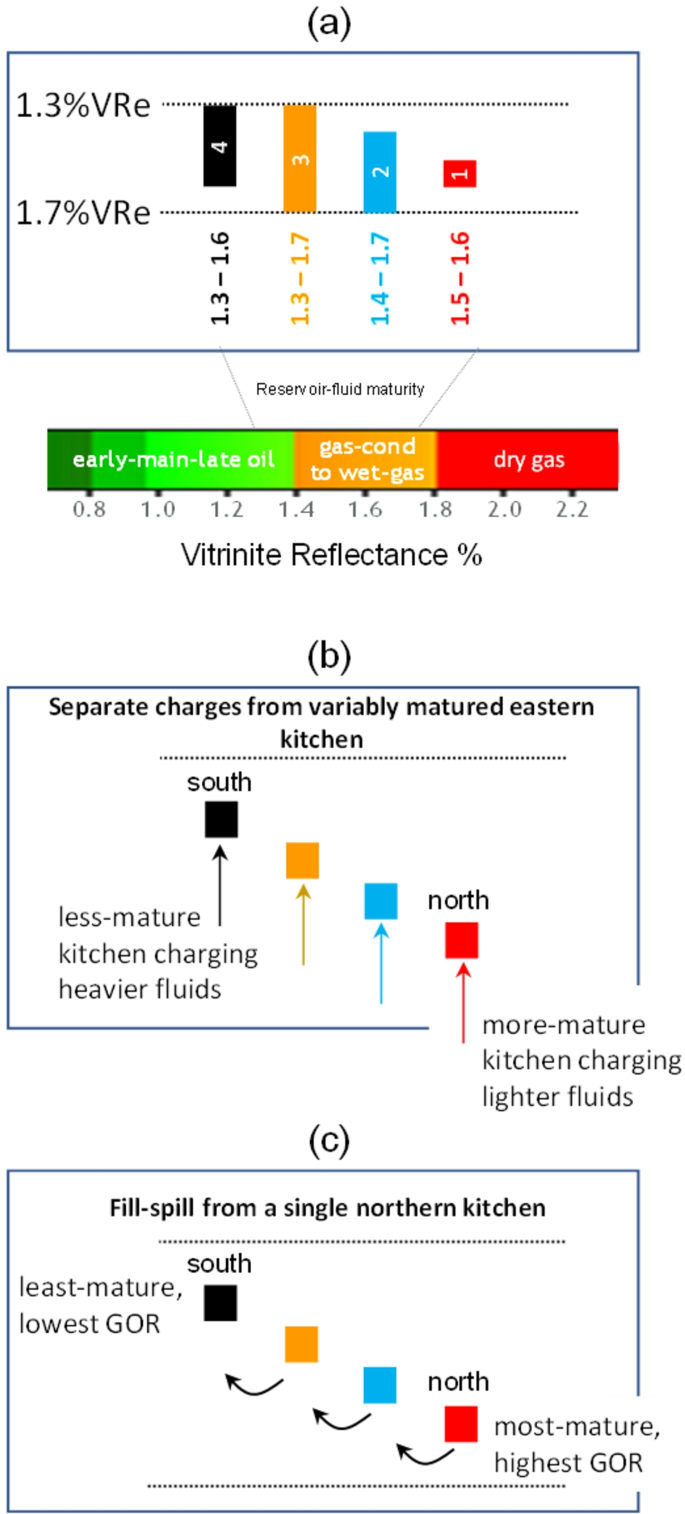
Ranges of fluid maturity in the different fields. The overlap in maturity ranges suggests migration via separate parallel pathways (from an expansive variably matured kitchen located to the east, panel b) rather than a single long-range fill-spill migration pathway from the north (panel c). Numbers 1 to 4 in panel a refer to field numbers.
Maturity control on reservoir pressure ratio and fluid distribution
Maturity control on fluid properties is further illustrated in Fig. 7. Higher-maturity charges towards the north gave rise to higher GOR, corresponding to lower gas wetness and heptane-plus (C7+) contents (Fig. 7a, b). The dewpoint pressure, in turn, correlates positively with the C7+ content, resulting in the observed reduction in dewpoint pressure towards the drier north (Field 1). The crossplot of GOR and saturation pressure is critical to understanding migration relationships between fluids and provides a key line of evidence that negates a single southward fill-spill migration across the different regions (Fig. 7c). A fill-spill along a single migration pathway would have depressurized the fluids updip, resulting in decreasing saturation pressure towards the updip south, which is clearly not the case (Figs. 7c and 8a). The lightest gas in the deeper north (Field 1) has the lowest dewpoint pressures, leading to greater reservoir pressure ratios (reservoir pressure to dewpoint pressure ratio nearing 2.0) and higher degrees of unsaturation compared to the updip north with pressure ratios close to 1.2 (Fig. 8b). This suggests that fluids remained a single-phase during migration (constant composition with no fractionation), hence favoring direct charging scenario rather than fill-spill.
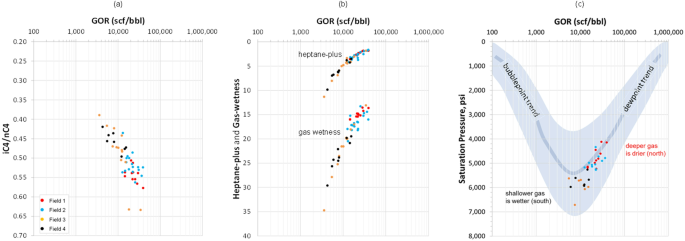
Control of charge maturity on (a) GOR, (b) gas wetness and heptane-plus (C7+) content, and (c) saturation pressure (dewpoint pressure in gas systems). Relationship between GOR and heptane-plus presented in Fig. 3 is also shown here for comparison.
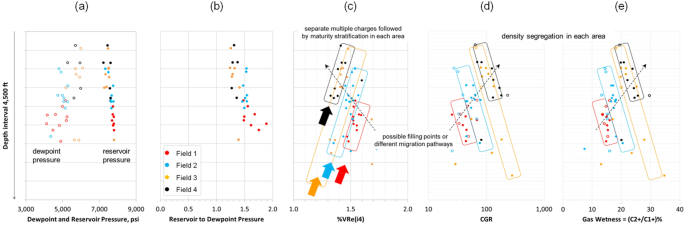
Depth profiles of (a) dewpoint and reservoir pressures, (b) reservoir pressure ratio, and (c–e) fluid properties. The black dashed arrows indicate the regional southward trend. Zonation by area reflects parallel charging into different areas, where, in each area, the fluid maturity increases updip while the CGR and gas wetness decrease as a result of maturity stratification and density segregation locally.
Depth profiles of fluid composition reveal a regional trend overarching local trends (Fig. 8c–e). The regional trend (indicated by black dashed arrow in Fig. 8c–e) reflects southward increase in CGR and gas wetness accompanied by a decrease in thermal maturity. Each of the four areas expresses localized trends reflective of gravity-chemical equilibrium (CGR and gas-wetness gradients) and %VRe maturity stratification, reflecting separate charges. Anomalies of drier gas are evident in some wells along the deeper eastern flanks, which possibly represent charging sites of fluids not in equilibrium with shallower fluid bodies.
Migration style (carrier vs. fault) and impact on fluid properties and distributions
Once hydrocarbons are expelled from the source rock, they migrate to the reservoir through carrier beds or via faults and fractures, assisted by buoyancy exceeding capillary forces22as well as by methane diffusion23. As discussed above, geochemically tracking oil migration is possible using a combination of migration-sensitive geotracers, maturity and source-specific biomarkers and stable C/H isotopes capable of establishing genetic and migrational links to source rocks and to other fields. Tracking gas migration is, however, more challenging due to the lack of biomarkers and geotracers and the limitation to gas isotope fingerprinting24. A petroleum system defined geologically or geophysically without geochemical evidence remains hypothetical or speculative25, hence the importance of developing new approaches that maximize the value of reservoir fluid data to constrain gas migration models and the spatial extents of petroleum systems. Fluid interpretation workflows, integrated with reservoir pressure, saturation pressure, charge and structural evolution analysis, were therefore developed and employed to assess fault and top seal integrity in several oil and gas fields in the Arabian Plate26. This type of work has significant implications for constraining migration scenarios (e.g., fill-spill vs. phase separation) and trapping mechanisms (e.g., buoyancy vs. capillary trapping) in both conventional and unconventional petroleum systems26,27,28. However, it is important for the level of alteration or modification of fluids within the reservoir to be properly assessed before PVT fluid data can be used for migration and reservoir charge assessment16,29.
This paper builds on our previous workflows and provides additional fluid-based insights on differentiating fault migration from carrier migration and the impact of different migration dynamics on reservoir fluid properties. Reactivated deep-seated Hercynian faults are known to cut through the subject reservoir, and were therefore speculated to have provided conduits for hydrocarbon migration (and remigration from deeper reservoirs) into the subject reservoir8. To explore whether the east-charging was via carrier beds or faults and the possible impact of fault migration on fluid properties and distributions, we created a spatial attribute map to calculate distance to nearest fault for each well (Fig. 9a), which was then cross-plotted against fluid properties. A broad regional trend can be observed, where lighter fluids of higher maturities (highest iC5/nC5 and lowest CGR) occur proximal to faults in some areas (Fig. 9b), suggesting fault migration.
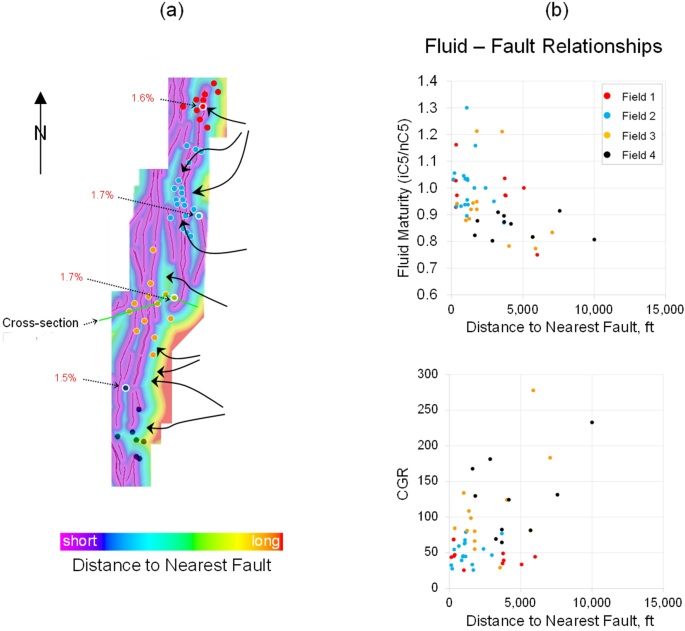
(a) Distance-to-fault attribute map across the four fields. (b) Correlations between fluid properties (maturity, CGR) and proximity to fault. Indicated in red on the map are the maximum %VRe(i4) in each area. Green line refers to the cross-section in Fig. 10. Major flowpaths from basin modeling are indicated in black arrows in “a”.
Easting compositional profiles illustrating fluid relations across faults were also created to better differentiate fault from carrier migration, as exemplified by Fig. 10 for Field 3. Here, carrier migration is the dominant charging style, identifiable by fluid compositional profiles (GOR density segregation/maturity stratification) that broadly conform to reservoir depth profiles. Two regional faults along the eastern flank of the structure show anomalously high readings in GOR and fluid maturity (blue circled in Fig. 10) superimposing the carrier-migration profiles, suggesting localized charge via faults. Note that the resultant drier gas is devoid of H2S, consistent with derivation from more-recent charges and/or remigration from deeper sweet-gas reservoirs present abundantly in the area and believed to have partially leaked into shallower reservoirs. The inferred fault migration agrees with our previous study on the underlying 1000-ft-thick gas reservoir where a 20-meter-thick zone of solid reservoir bitumen was formed atop the giant gas reservoir immediately below the regional Hercynian unconformity separating the two reservoirs in response to fault-assisted gas leakage14,26,28.
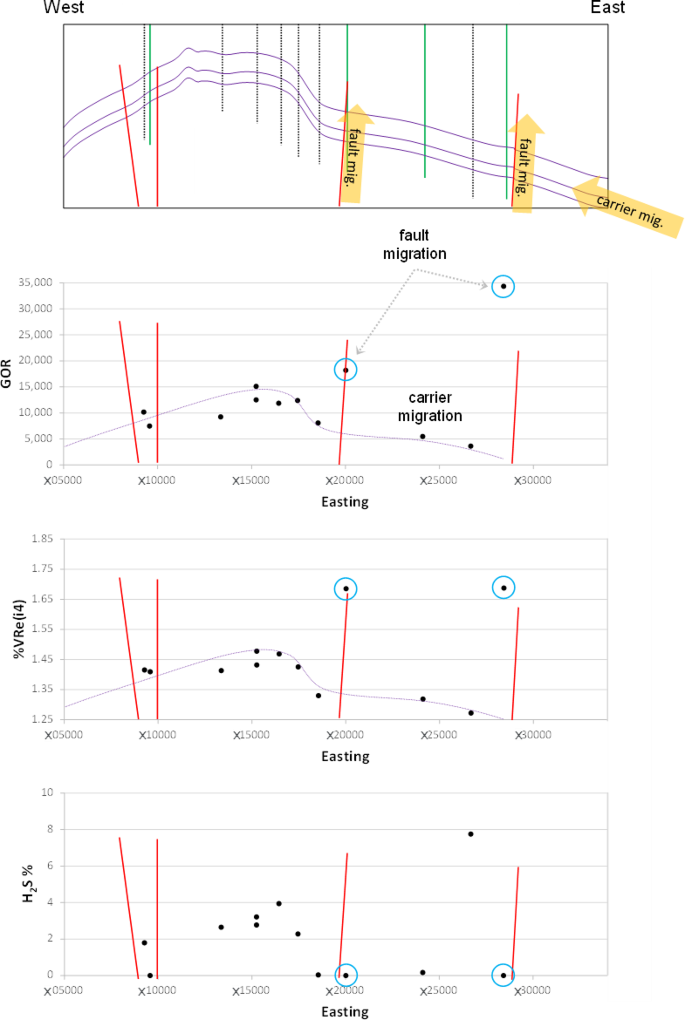
East-west cross-section and fluid easting profiles across Field 3 illustrating relations of reservoir fluids across faults. Fault migration is indicated by anomalies in fluid properties superimposing carrier migration. Well-lines in green are those intersected in green cross-section line shown in Fig. 9; other wells are projections.
Across all accumulations, carrier migration appears to have provided the initial charge (characterized by normal density/maturity stratification profiles that conform to reservoir depth), followed by fault migration in areas where faults were more responsive to structural reactivation, evidently here along the eastern flank of the regional trend. Future work will investigate the role of fault-controlled migration and its dynamic impact on fluid disequilibrium, compartmentalization, and gas productivity in more detail.
Cluster analysis for migration assessment
Cluster analysis of key fluid properties [%VRe(i4), %VRe(i5), GOR, %C1-C7+, %N2, %CO2, %H2S, gas dryness (%C1/C1-5), and saturation pressure (Psat)] identifies four main clusters (Fig. 11a). Clusters 1 and 2 form a closer couplet that correspond to Fields 1 and 2, while clusters 3 and 4 correspond collectively to Fields 3 and 4. Overlaps do occur, where four wells from Field 2 plot amongst cluster 1. These wells are located midway between the two respective accumulations, and their overlapping assignment is likely due to sharing the same fetch area feeding both structures. This interpretation agrees with key flowpaths extracted from basin modeling (black arrows in Fig. 9a). A stronger overlap is observed among Fields 3 and 4, interpreted to reflect vertical reservoir heterogeneity or mixing of charges from two broadly identified fetch areas to the east. Heavily TSR-altered fluids from Field 2 (samples 17 and 18) deviate slightly from their respective cluster; a deviation that is also observed for fluids 37 and 42 believed to be in disequilibrium due to recent charging.
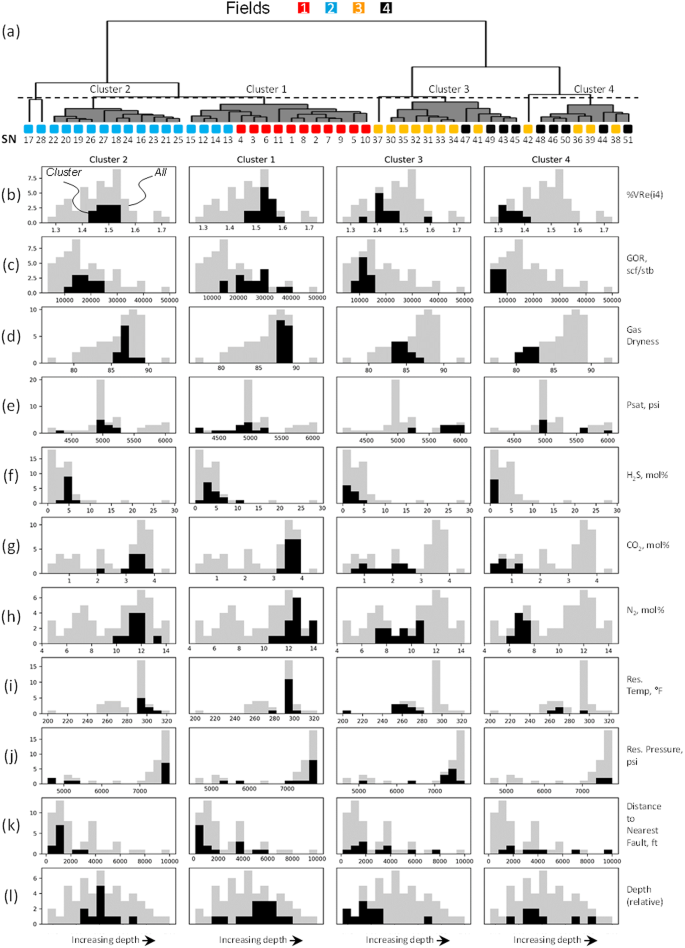
(a) Cluster analysis of key fluid properties [%VRe(i4), %VRe(i5), GOR, %C1-C7+, %N2, %CO2, %H2S, gas dryness (%C1/C1 − 5), and saturation pressure (Psat)] identified four main clusters. (b–l) Histograms summarizing key fluid properties and trends among the four clusters.
Histograms summarizing key fluid properties and trends among the four clusters are presented in Fig. 11. Fluid maturity [%VRe(i4)] generally decreases from Field 1 (north) to Field 4 (south), a trend mirrored by GOR and gas dryness, both increasing towards the north. The trends also generally follow the depths of the reservoir and adjacent basin, which is here favored as the main cause for the observed variations in fluid maturity and other fluid properties, i.e. parallel charging from an east-lying/north-dipping kitchen. Proximity to fault also appears to have control over gas dryness, as clearly manifested for the northern Fields 1 and 2, suggesting stronger contributions from fault migration supplementing carrier migration. Bias in sample coverage in relation to proximity to fault should, however, be considered, as more samples were taken from wells closer to faults in the northern areas than the southern areas. This is illustrated in Fig. 10 for Field 3, where anomalies in fluid properties clearly indicate localized features ascribed to fault migration. This suggests that fault migration might have a more regional effect on fluid properties than observed here, particularly where faults are located downdip along migration pathways.
The observed clustering corresponds well to migration analysis discussed above, negating a single southward fill-spill migration from the north (clusters 1/2) all the way to the south (clusters 3/4), as the fluids in the south have higher saturation pressures. Original GOR in the north (clusters 1/2) was likely higher, being reduced by TSR that intensifies with depth and temperature, as testified by increased gas souring (higher H2S, CO2, and N2 content). Furthermore, the observed overlap between the clusters does not support a north-charging fill-spill scenario, whereby each field would be expected to have its own cluster as dictated by the fluid maturity.