I used QGIS & Jupyter Notebook to analyze data from the NYC Board of Elections, Campaign Finance Bureau, and got maps from NYC OpenData.
Andrew Cuomo’s Gained and Lost Votes between 2018 & 2025 vs. Zohran Mamdani’s 2025 Vote Margin over Cuomo’s 2018 Challenger. The size of dark blue bubbles reflects the number of votes Cuomo lost, and green bubbles reflect votes he gained, in that neighborhood in 2025 relative to his performance in 2018. Yellow bubbles reflect the number of votes Mamdani earned over and above the total Cuomo’s challenger, Cynthia Nixon, earned in 2018. Light grey neighborhoods have the lowest rates of food insecurity. Dark grey neighborhoods have the highest rate of food insecurity.
I’m a data analyst, and former neuroscientist starting a new leftist political data substack, please check it out! It’s high quality data journalism,! If you like it, please get it shared everywhere you can!
Thanks!
In Astoria and LIC the area was the most food insecurity are the Queensborough projects they voted Cuomo by last margin, this infographic seems to hide a lot of important information.
Coloured dots are super confusing
In a gubernatorial election it’s a very different base that has to be appealed to NY is a very purple state but NYC is a very blue city, so how candidates represent themselves is very different, also what policies they chose are different because of the budget constraints are different.
For example the free buses will need budget approval from the state which they will probably deny, Mamdani can then say hey I tried but the state…and then not get too much political flack for it, that is very different when running for governor.
For ranked choice voting there was no pressure to rank cuomo as 1st, and likewise in the gubernatorial race there was no spoiler effects from third candidates.
I am interested in learning more about the relationship between rents and voting choices, where mamdani dominated in Brooklyn it is known for lots of young professionals earning a lot but with a high COL.
Running on a platform of blaming the Jews for everything has a historic precedent sadly
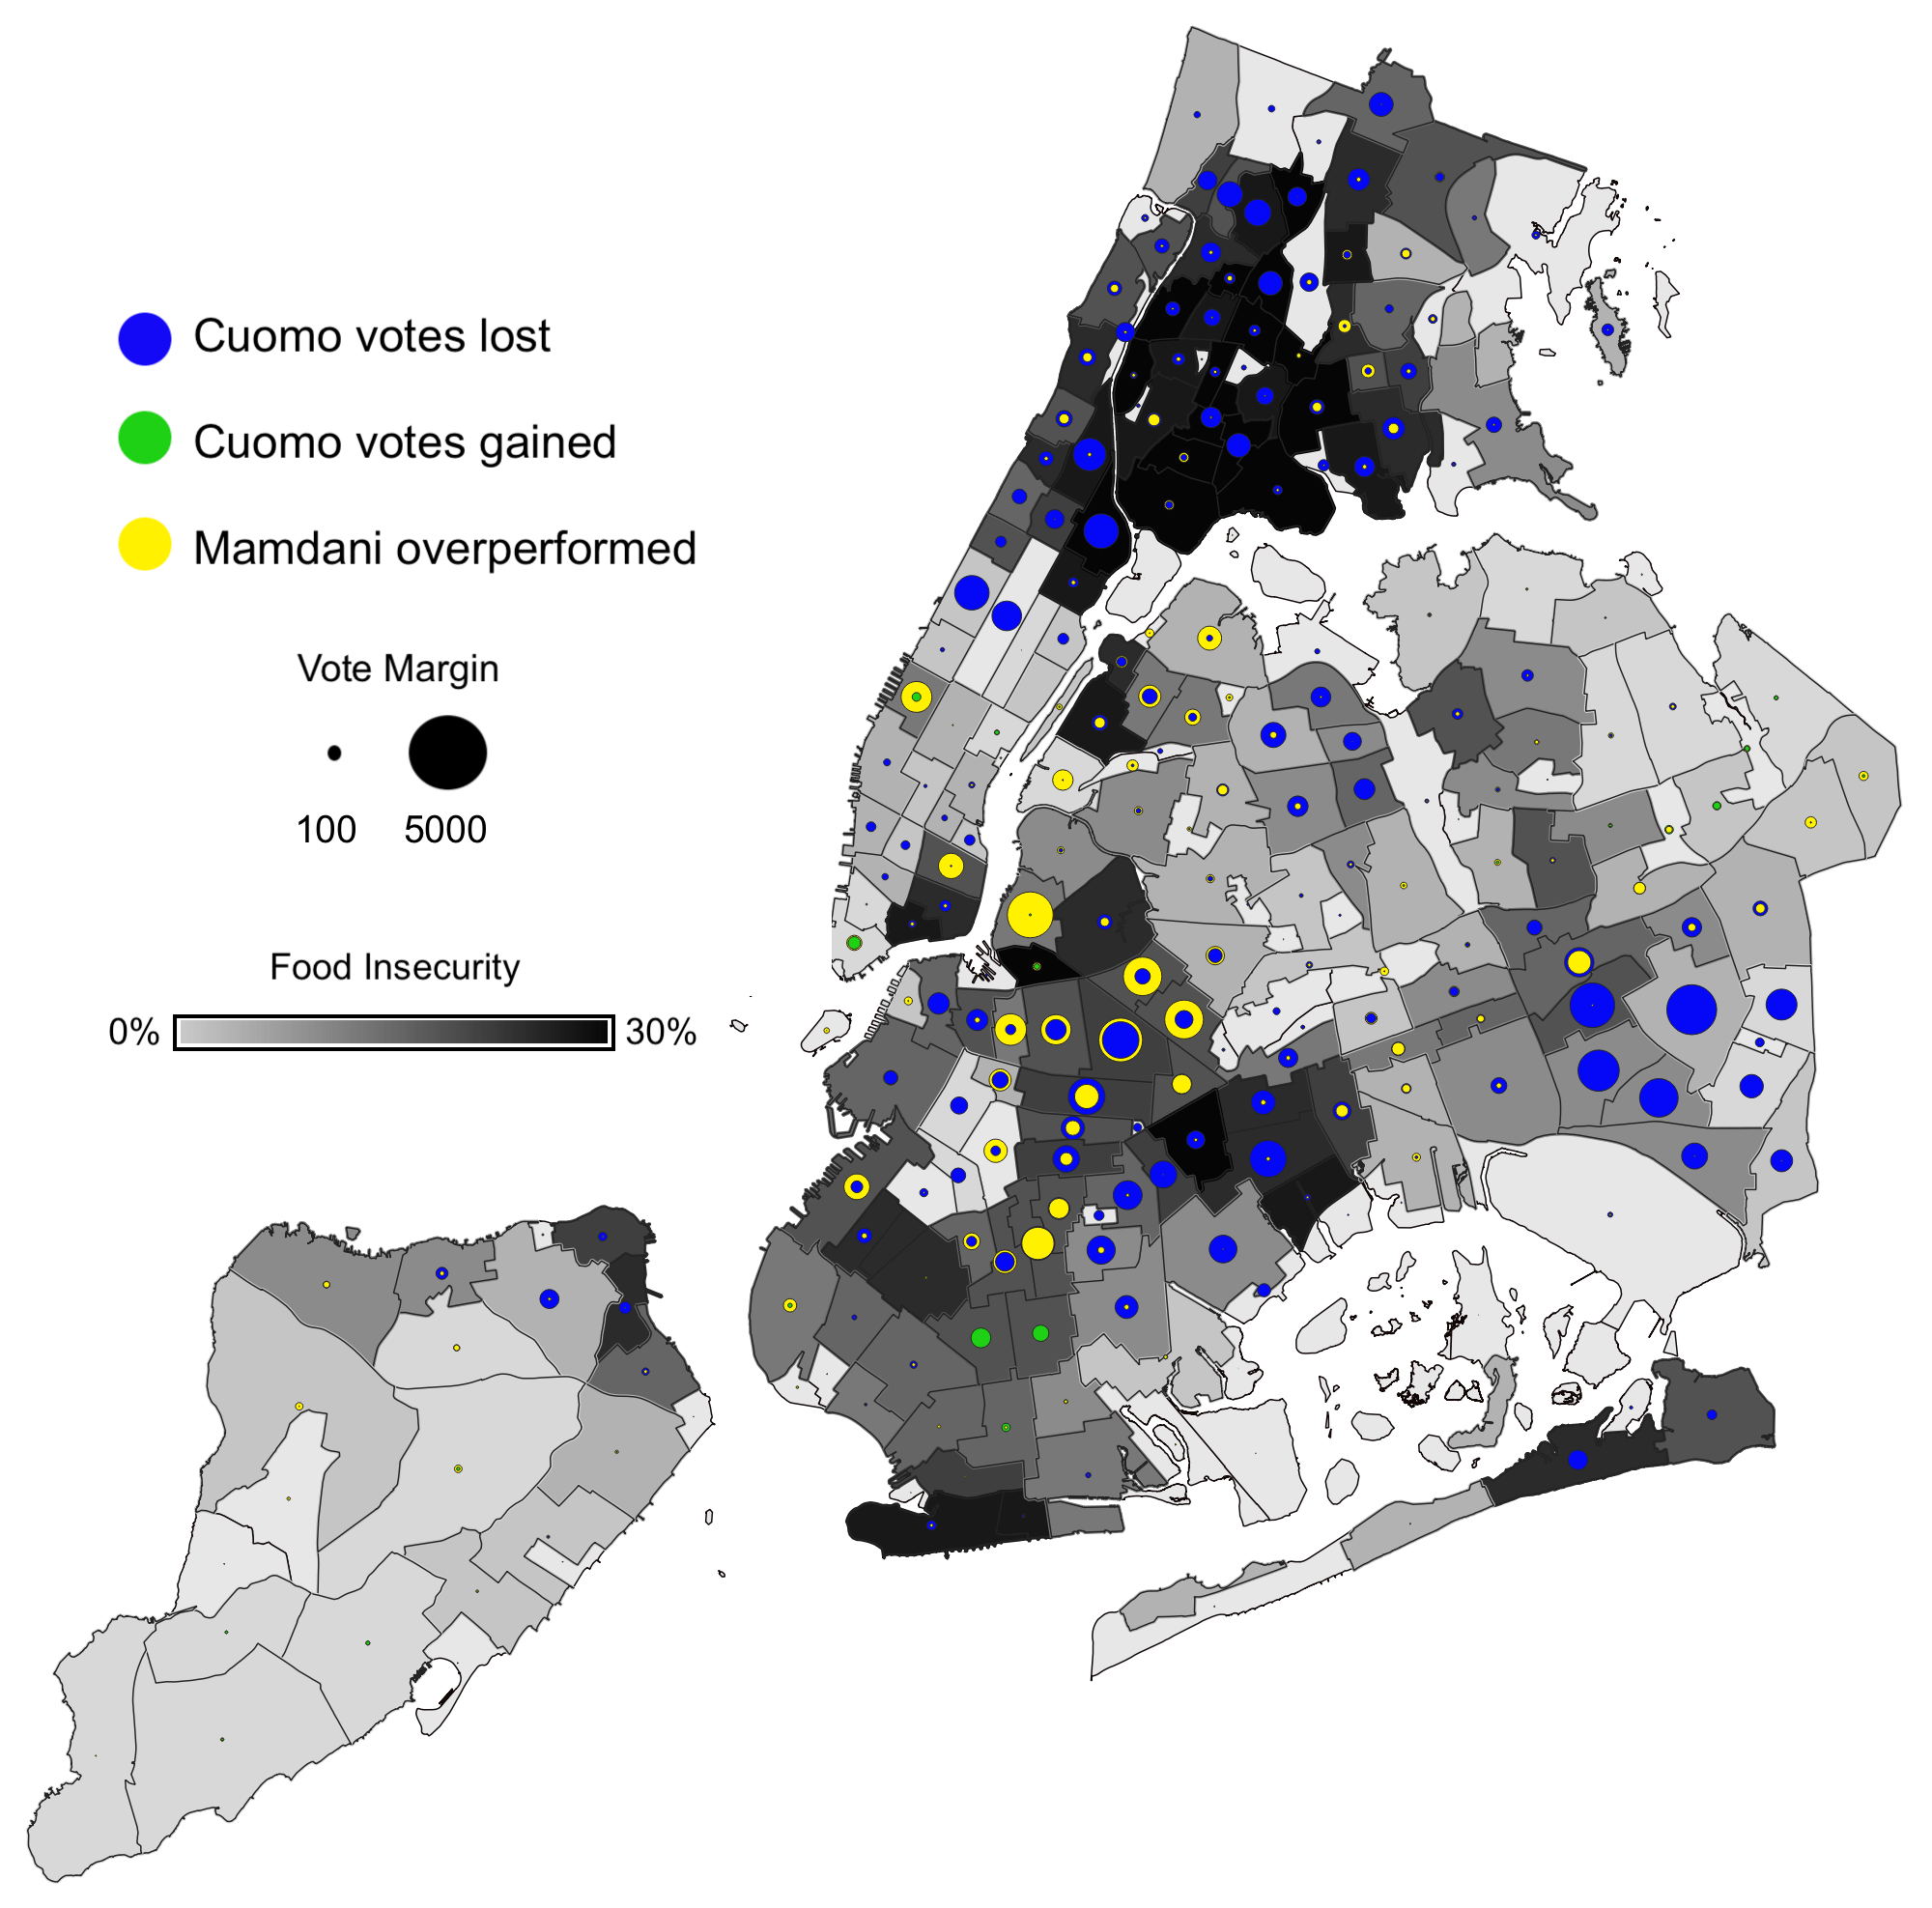
![[OC] Zohran Mamdani won over Cuomo's 2018 base in areas with higher food insecurity](https://www.europesays.com/wp-content/uploads/2025/07/x6hvdbrg32cf1-1920x1024.png)
5 comments
I used QGIS & Jupyter Notebook to analyze data from the NYC Board of Elections, Campaign Finance Bureau, and got maps from NYC OpenData.
Andrew Cuomo’s Gained and Lost Votes between 2018 & 2025 vs. Zohran Mamdani’s 2025 Vote Margin over Cuomo’s 2018 Challenger. The size of dark blue bubbles reflects the number of votes Cuomo lost, and green bubbles reflect votes he gained, in that neighborhood in 2025 relative to his performance in 2018. Yellow bubbles reflect the number of votes Mamdani earned over and above the total Cuomo’s challenger, Cynthia Nixon, earned in 2018. Light grey neighborhoods have the lowest rates of food insecurity. Dark grey neighborhoods have the highest rate of food insecurity.
This is an OC post. If y’all want a Leftwing-Nate-Silver-style deep data analysis debunking the myth that Mamdani has a ‘problem’ winning over working class voters, check out my analysis [here](https://open.substack.com/pub/leegans/p/data-show-mamdani-won-on-his-agenda?r=cuqb7&utm_campaign=post&utm_medium=web&showWelcomeOnShare=true).
I’m a data analyst, and former neuroscientist starting a new leftist political data substack, please check it out! It’s high quality data journalism,! If you like it, please get it shared everywhere you can!
Thanks!
In Astoria and LIC the area was the most food insecurity are the Queensborough projects they voted Cuomo by last margin, this infographic seems to hide a lot of important information.
Coloured dots are super confusing
In a gubernatorial election it’s a very different base that has to be appealed to NY is a very purple state but NYC is a very blue city, so how candidates represent themselves is very different, also what policies they chose are different because of the budget constraints are different.
For example the free buses will need budget approval from the state which they will probably deny, Mamdani can then say hey I tried but the state…and then not get too much political flack for it, that is very different when running for governor.
For ranked choice voting there was no pressure to rank cuomo as 1st, and likewise in the gubernatorial race there was no spoiler effects from third candidates.
I am interested in learning more about the relationship between rents and voting choices, where mamdani dominated in Brooklyn it is known for lots of young professionals earning a lot but with a high COL.
Running on a platform of blaming the Jews for everything has a historic precedent sadly
Comments are closed.