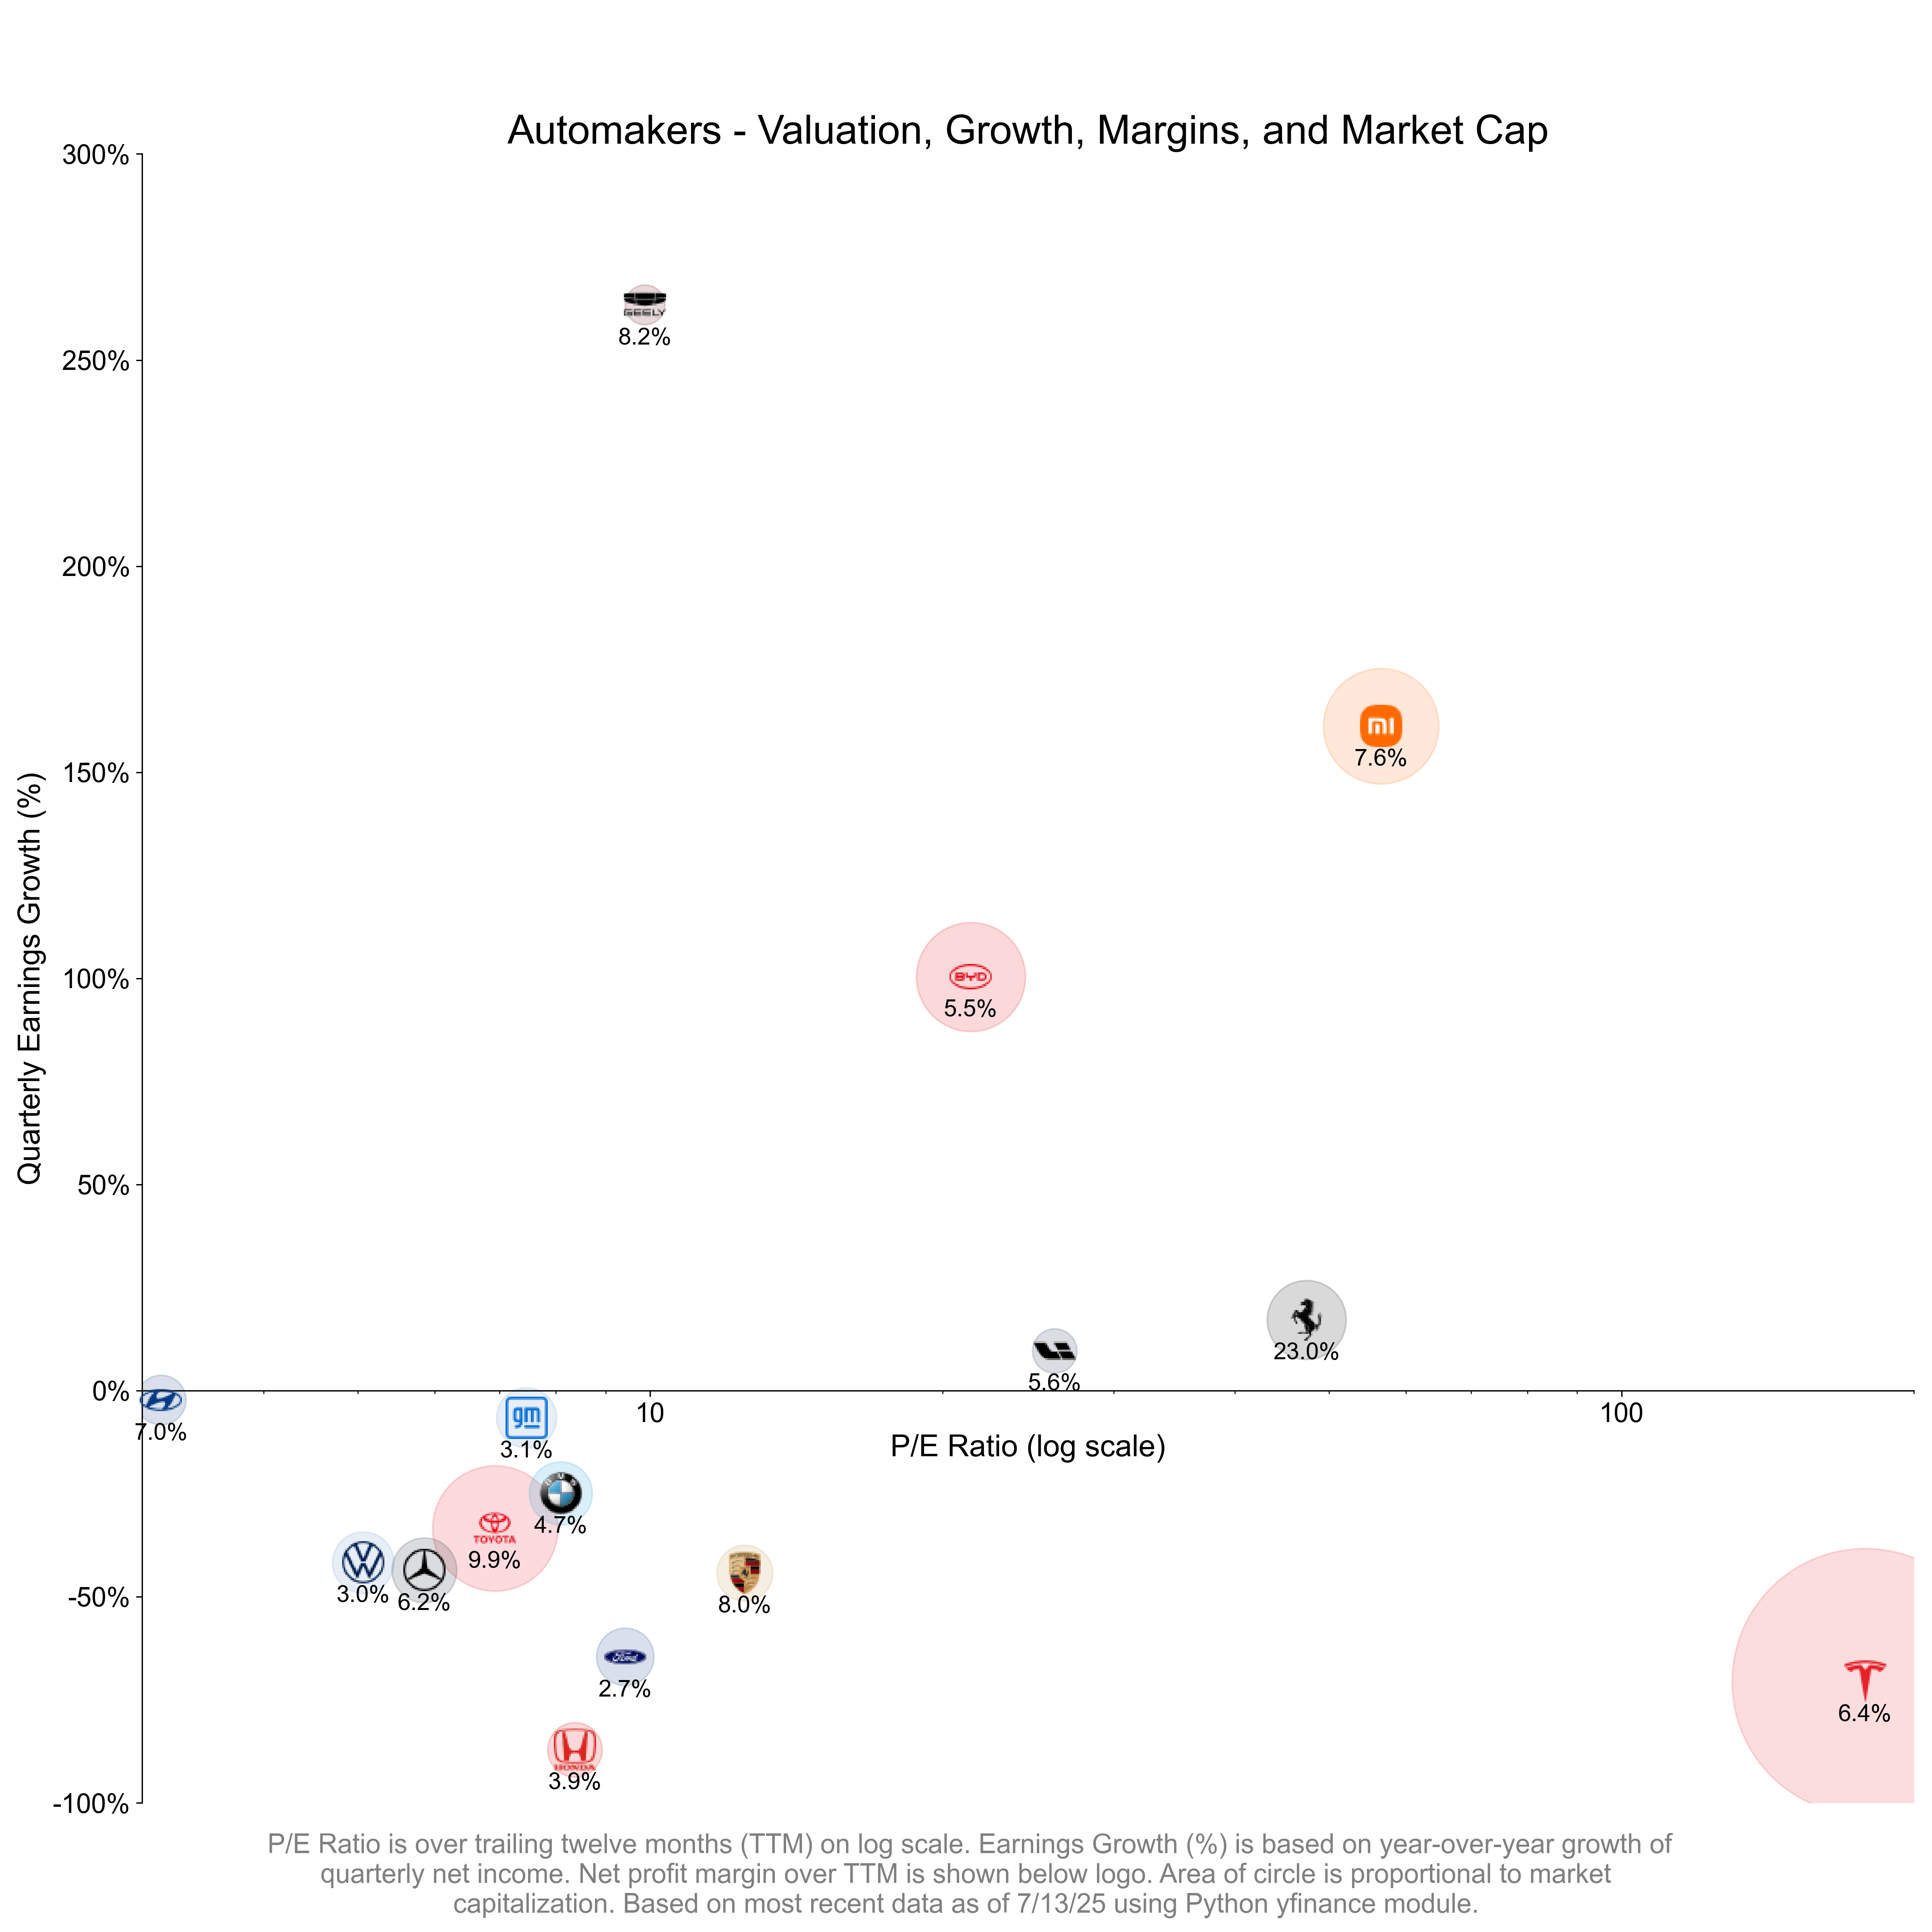
The auto industry has had it rough, marked by contracting growth rates, margins, and valuations across all companies. How do they compare in terms of fundamentals?
In order to get them to fit on the same graph, I had to use a logarithmic scale on the x-axis because the P/E ratio goes from 3.14 for Hyundai to 178.13 for Tesla. Growth rates vary quite a bit, with most of the legacy automakers in decline. The Chinese EV industry is doing much better, while once-dominant Tesla is rapidly conceding its early lead; smaller US competitors like Rivian and Lucid are hurting even more. Margins are pretty similar for all automakers, legacy and EV alike, with the exception of luxury automaker Ferrari which stands out.
Not shown on these plots are unprofitable companies with a negative P/E ratio or those which had recently flipped from negative to positive, for which the “growth rate” would be meaningless (they were excluded by the script that I ran). Their data are shown below.
| Ticker | Name | P/E | Market Cap (USD) | Growth Rate | Net Margin |
|:—|:—|:—|:—|:—|:—|
| TSLA | Tesla, Inc. | 178.13 | $1009.8B | -70.60% | 6.38% |
| TM | Toyota Motor Corporation | 6.92 | $223.4B | -33.40% | 9.92% |
| XIACF | Xiaomi Corporation | 56.54 | $189.3B | 161.20% | 7.57% |
| BYDDY | BYD Company Limited | 21.38 | $168.9B | 100.40% | 5.45% |
| RACE | Ferrari N.V. | 47.41 | $88.8B | 17.20% | 22.99% |
| MBG.DE | Mercedes-Benz Group AG | 5.86 | $59.7B | -43.60% | 6.23% |
| BMW.DE | Bayerische Motoren Werke Aktiengesellschaft | 8.09 | $56.6B | -24.90% | 4.73% |
| VOW3.DE | Volkswagen AG | 5.06 | $53.7B | -41.70% | 3.04% |
| GM | General Motors Company | 7.46 | $51.3B | -6.60% | 3.08% |
| F | Ford Motor Company | 9.42 | $46.8B | -64.60% | 2.74% |
| P911.DE | Dr. Ing. h.c. F. Porsche AG | 12.51 | $44.5B | -44.20% | 7.97% |
| HMC | Honda Motor Co., Ltd. | 8.37 | $42.2B | -87.10% | 3.85% |
| HYMTF | Hyundai Motor Company | 3.14 | $35.1B | -2.30% | 6.96% |
| STLA | Stellantis N.V. | 4.66 | $30.5B | N/A | 3.49% |
| 000270.KS | Kia Corporation | N/A | $28.9B | -14.80% | 8.57% |
| LI | Li Auto Inc. | 26.09 | $28.1B | 9.70% | 5.59% |
| 0175.HK | GEELY AUTO | 9.88 | $22.6B | 263.40% | 8.15% |
| XPEV | XPeng Inc. | N/A | $16.6B | N/A | -10.15% |
| RIVN | Rivian Automotive, Inc. | N/A | $15.6B | N/A | -76.83% |
| NIO | NIO Inc. | N/A | $8.4B | N/A | -35.80% |
| 7201.T | Nissan Motor Co., Ltd. | N/A | $7.3B | N/A | -5.31% |
| LCID | Lucid Group, Inc. | N/A | $7.0B | N/A | -275.73% |
What is wrong with Hyundai? I see lots of them. They are decent cars. They seem to be profitable. Good EV offerings, so a reasonable expectation of growth. Why the worst P/E?
The image is neat. Kind of highlights how out there Tesla is in price.
![[OC] Automakers - Valuation, Growth, Margins, and Market Cap](https://www.europesays.com/wp-content/uploads/2025/07/p1kqaokvemcf1-1920x1024.png)
2 comments
The auto industry has had it rough, marked by contracting growth rates, margins, and valuations across all companies. How do they compare in terms of fundamentals?
In order to get them to fit on the same graph, I had to use a logarithmic scale on the x-axis because the P/E ratio goes from 3.14 for Hyundai to 178.13 for Tesla. Growth rates vary quite a bit, with most of the legacy automakers in decline. The Chinese EV industry is doing much better, while once-dominant Tesla is rapidly conceding its early lead; smaller US competitors like Rivian and Lucid are hurting even more. Margins are pretty similar for all automakers, legacy and EV alike, with the exception of luxury automaker Ferrari which stands out.
Not shown on these plots are unprofitable companies with a negative P/E ratio or those which had recently flipped from negative to positive, for which the “growth rate” would be meaningless (they were excluded by the script that I ran). Their data are shown below.
| Ticker | Name | P/E | Market Cap (USD) | Growth Rate | Net Margin |
|:—|:—|:—|:—|:—|:—|
| TSLA | Tesla, Inc. | 178.13 | $1009.8B | -70.60% | 6.38% |
| TM | Toyota Motor Corporation | 6.92 | $223.4B | -33.40% | 9.92% |
| XIACF | Xiaomi Corporation | 56.54 | $189.3B | 161.20% | 7.57% |
| BYDDY | BYD Company Limited | 21.38 | $168.9B | 100.40% | 5.45% |
| RACE | Ferrari N.V. | 47.41 | $88.8B | 17.20% | 22.99% |
| MBG.DE | Mercedes-Benz Group AG | 5.86 | $59.7B | -43.60% | 6.23% |
| BMW.DE | Bayerische Motoren Werke Aktiengesellschaft | 8.09 | $56.6B | -24.90% | 4.73% |
| VOW3.DE | Volkswagen AG | 5.06 | $53.7B | -41.70% | 3.04% |
| GM | General Motors Company | 7.46 | $51.3B | -6.60% | 3.08% |
| F | Ford Motor Company | 9.42 | $46.8B | -64.60% | 2.74% |
| P911.DE | Dr. Ing. h.c. F. Porsche AG | 12.51 | $44.5B | -44.20% | 7.97% |
| HMC | Honda Motor Co., Ltd. | 8.37 | $42.2B | -87.10% | 3.85% |
| HYMTF | Hyundai Motor Company | 3.14 | $35.1B | -2.30% | 6.96% |
| STLA | Stellantis N.V. | 4.66 | $30.5B | N/A | 3.49% |
| 000270.KS | Kia Corporation | N/A | $28.9B | -14.80% | 8.57% |
| LI | Li Auto Inc. | 26.09 | $28.1B | 9.70% | 5.59% |
| 0175.HK | GEELY AUTO | 9.88 | $22.6B | 263.40% | 8.15% |
| XPEV | XPeng Inc. | N/A | $16.6B | N/A | -10.15% |
| RIVN | Rivian Automotive, Inc. | N/A | $15.6B | N/A | -76.83% |
| NIO | NIO Inc. | N/A | $8.4B | N/A | -35.80% |
| 7201.T | Nissan Motor Co., Ltd. | N/A | $7.3B | N/A | -5.31% |
| LCID | Lucid Group, Inc. | N/A | $7.0B | N/A | -275.73% |
What is wrong with Hyundai? I see lots of them. They are decent cars. They seem to be profitable. Good EV offerings, so a reasonable expectation of growth. Why the worst P/E?
The image is neat. Kind of highlights how out there Tesla is in price.
Comments are closed.