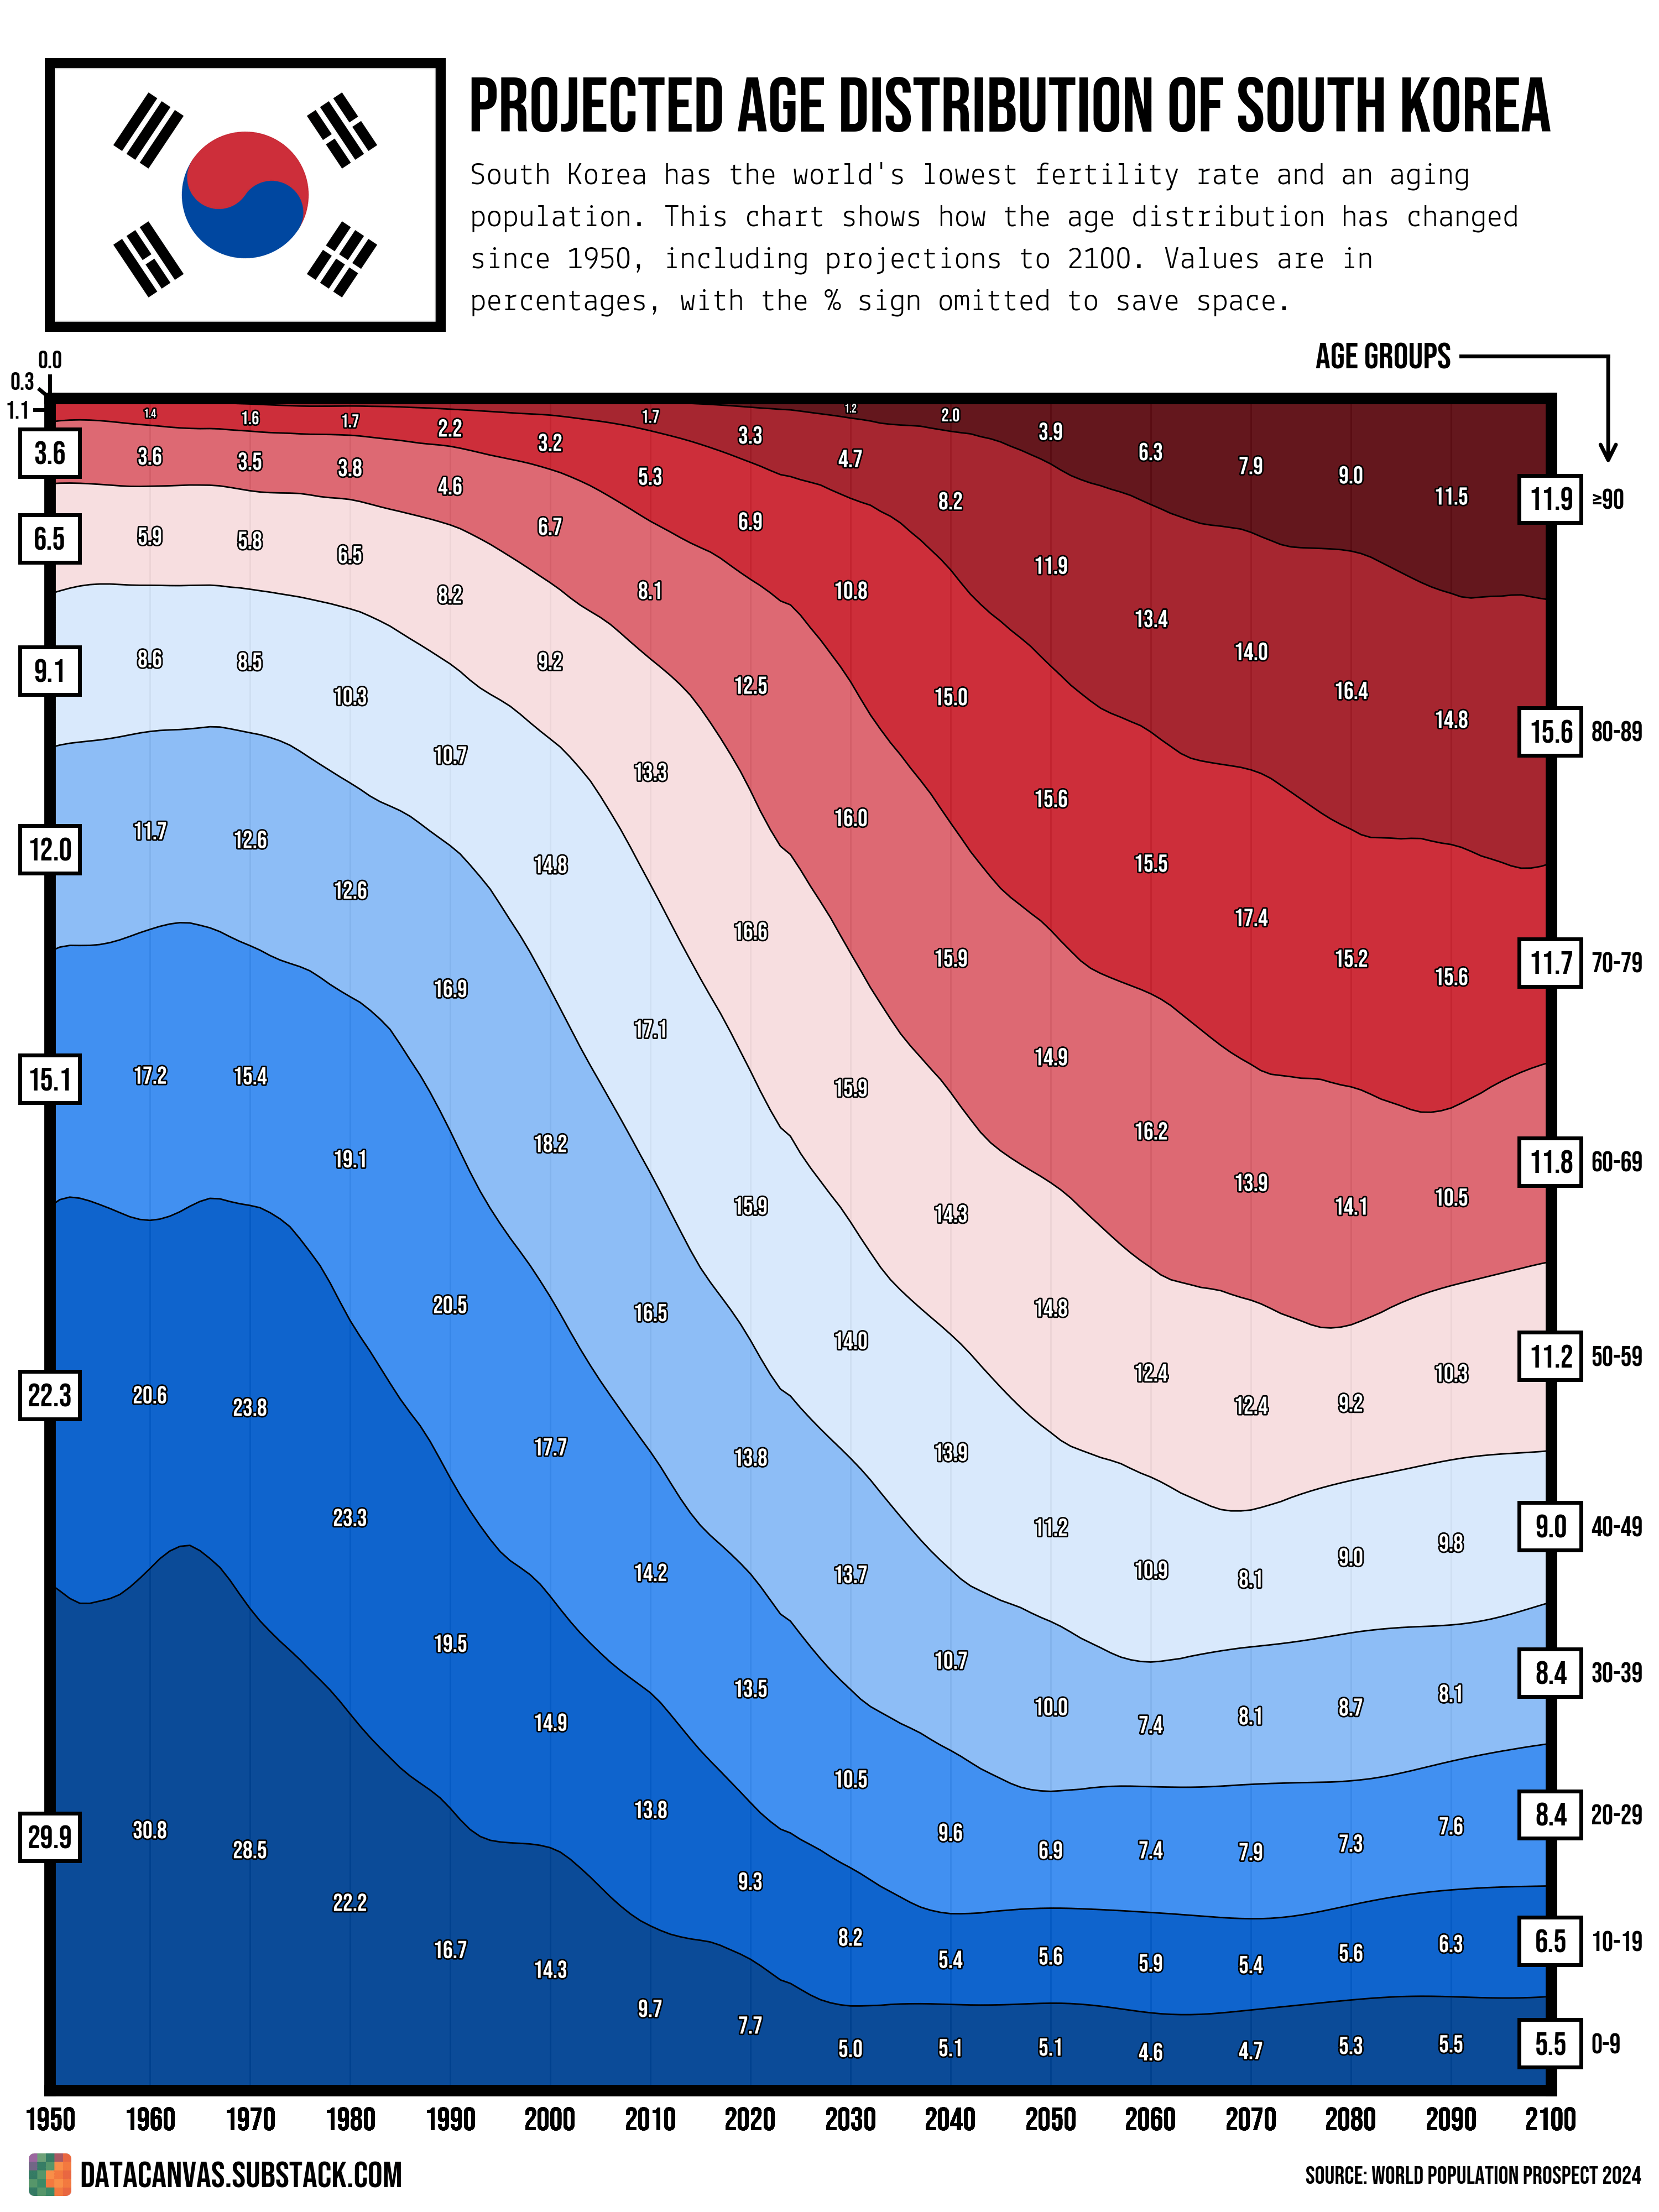
Data source: World Population Prospect – Population by Single Age, Both Sexes
Tools used: Matplotlib
Posted by oscarleo0
![[OC] Historical and Projected Age Distribution for South Korea](https://www.europesays.com/wp-content/uploads/2025/07/ki8myxe1kncf1-1920x1024.png)
Data source: World Population Prospect – Population by Single Age, Both Sexes
Tools used: Matplotlib
Posted by oscarleo0
24 comments
Kurzgesagt did an episode on South Korea’s population problem, it was pretty bleak. https://youtu.be/Ufmu1WD2TSk
Yeah, because data extrapolations 75 years into the future are definitely reliable.
Just like all the predictions from 1950 on how life in 2025 would be.
Just the flying cars and household robots will still have to wait 🙁
This seems to imply a great healthcare system for the elderly with no funding from the young. Would life expectancy really continue to climb in such an economy? Generally infrastructure would crumble without investment I would think? This feels pretty idyllic, finding some form of stability. I would not be so confident that is achievable.
really cool work. love this data visualization, OP.
I gotta learn how to do it myself
Those nursing homes are gonna be lit in 2069
I knew it was one of the worst in the world, but the visualization is staggering.
Great color scale choice matching the Korean flag
South Korea is really bad for this.
I have a good friend who’s daughter is teaching over there (female). She would like to become a citizen and has been there for about 6 years now. But they do not want foreigners to boost the population.
They want Koreans to have more Koreans and make it very very difficult to emigrate there and get citizenship.
Basically, she is there for another year or two and then leave so a female professional that could have kids there, can’t become a citizen on her own, she has to marry to become one.
If she stays long term just working, she can’t retire there as the services wouldn’t be available to her as a non-citizen if she retired there.
Its just backward thinking in my mind.
That and the fact that the pollution is so bad its making everyone sterile.
What’s missing from these charts is the fact that S. Korea’s population is expected to be reduced by 50% by 2100.
I know the colors are from the ROK flag, but the way the graph looks reminds me of the old Pepsi logo.
as many >=90 year olds as <20 year olds is uh kinda fucked
Demographic freight train is heading towards them and it can’t be stopped. This will kill the majority of retirement possibilities for them. Also puts them at risk of being taken over because there’s no young people to defend.
S Korean population in 1950 approximately was 20m and now is approximately 52m. So 150% greater and combined with the 1950 life expectancy of about 36! (war is hell) and now at 84 one of the oldest in the world. It stands to reason that since people are living so much longer and the population is so much larger that it would have a more equal distribution. The starting point really skews the graph.
Can you do a version where, as it flows to the right, it shows the level of population shriking?
90-100 being over twice the size of 0-10 is hilarious
It looks too optimistic to me. How do we know that the new births will stay constant after some point? They should also go down if there is no significant improvement in birth rates, right?
People are talking about the “problem” in Korea—but that’s a matter of perspective. At least today if you are born in Korea you have a chance at a good life (in South Korea) and to live to an old age.
I don’t think anybody in either the North or the South would trade with the life of their grandparents. Before 1950, it was a country in poverty, having been under foreign oppression for decades, and with little chance of anyone living to an old age. I have read that in some respects South Korea (and secondly, China) have made more rapid advancement in raising the standard of living than any place on earth. So, problems are always relative.
Scrolling by I thought this was an advert for Pepsi
Don’t worry guys, reddit says this is only a problem for the billionaires. Everyone else will be fine.
I dont see any problem everybody talk. Look at the chart again share of people 20-70 changed very low. Everybody talk about big amount of elderly people, but people beloew 20 don’t work and don’t pay taxes. Moreover they also need government money for schools, for kindergatrtens, for univercities, share of elders balanced by share of toungers
Why is it expected to get better around the 2070’s?
In reality, this is too optimistic. It assumes the percentage of children will be constant after 2030, and the percentage of young adults constant after ~2050, but in reality these percentages will continue shrinking (because their parents’ cohorts, already born, will be shrinking). The only way these numbers could work is if the fertility rate jumps to ~3 in the next couple decades – good luck with that.
Too bad there is literally no way to fix this
Oh yes except immigration
The projection is wrong. There is no way that many 90+ years old still live when society cannot afford the level of care. Same with pension/retirement benefits even if it’s guaranteed by government. The system will collapse or be forced to reform when the money runs out. The life expectancy cannot increase forever.
Comments are closed.