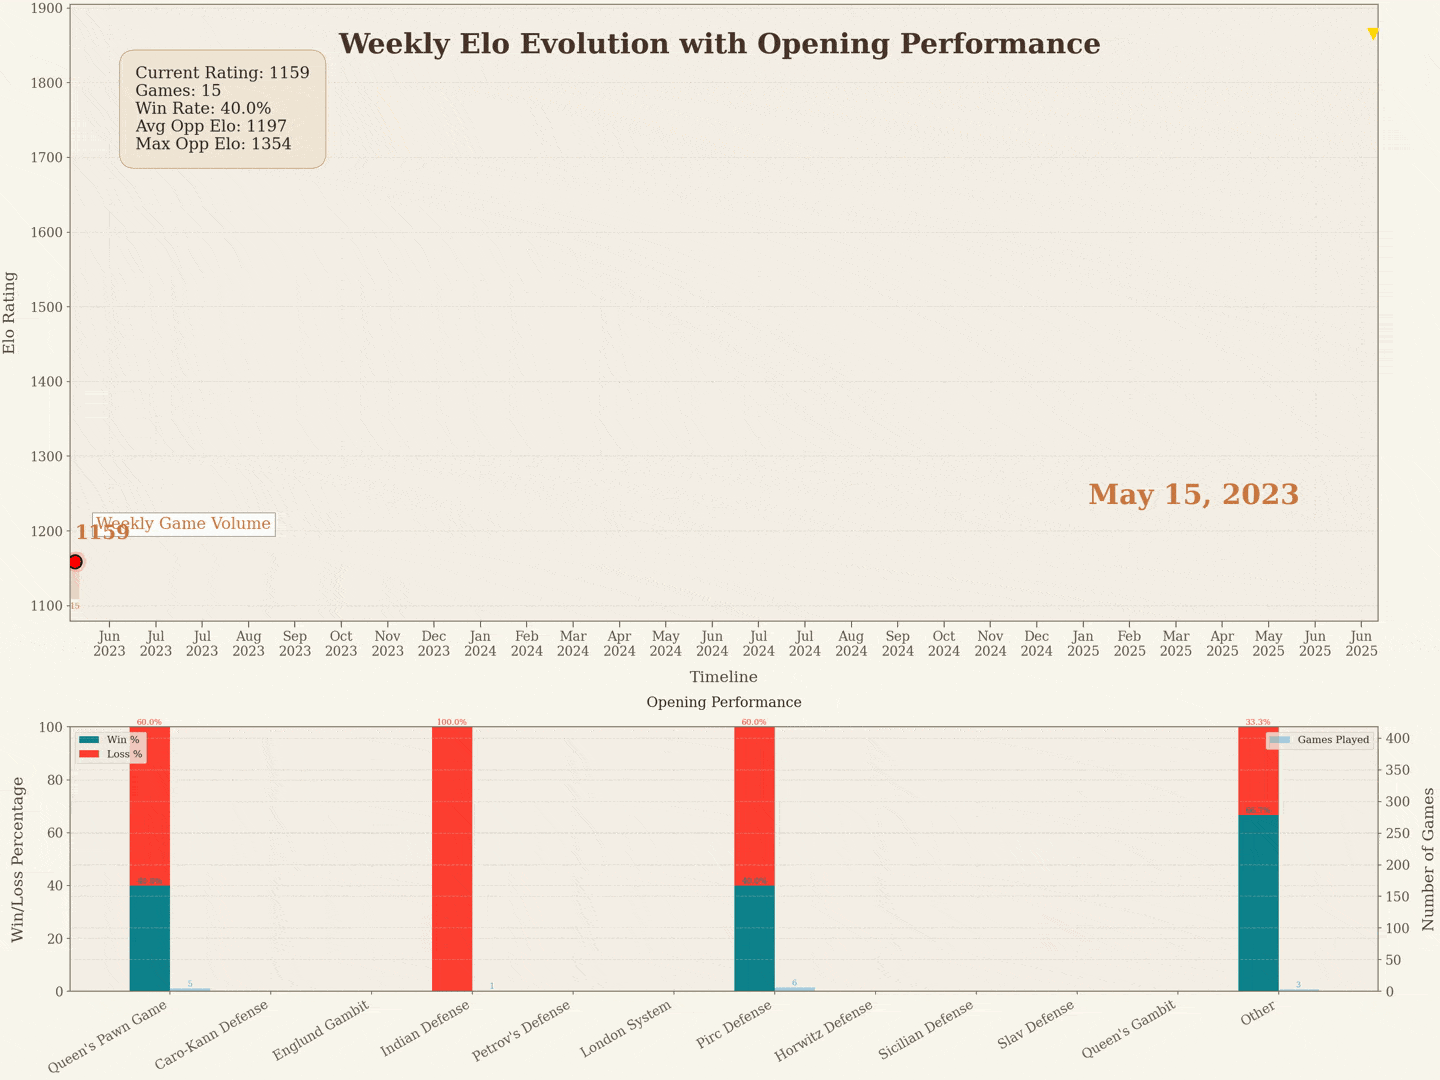
[OC] Visualization of my Chess Elo progression from 2023 to July 2025 in Lichess, with opening win/loss stats over time.
Posted by rift026
![[OC] Visualization of my Chess Elo progression from 2023 to July 2025 in Lichess, with opening win/loss stats over time.](https://www.europesays.com/wp-content/uploads/2025/07/5ld1g2m0wpcf1-1440x1024.gif)
[OC] Visualization of my Chess Elo progression from 2023 to July 2025 in Lichess, with opening win/loss stats over time.
Posted by rift026
3 comments
Tools used: Python.
Libraries used: Numpy, Matplotlib, python-chess, FuncAnimation
My Lichess Account: [https://lichess.org/@/Rift026](https://lichess.org/@/Rift026)
This is really interesting data but doesn’t need to be animated. The animation makes it harder to analyze because I can only see the complete data set for a split second at the end before it loops back to the beginning also the data at the bottom is fluctuating so much due to low sample sizes that it doesn’t have any meaning until the end where again I can only see it for a fraction of a second. I would have to watch this loop like 50 times to actually be able to digest the data.
Summary. Cool data. Cool and informative layout. Animation kinda ruins it all.
EDIT: u/BrovaloneCheese helped identify that pausing the animation is possible on Windows computers as well as mobile reddit. It is not available on MacOS for some reason.
I like the volume bars because they remind me of day trading lmao
Comments are closed.