Data from [https://ember-energy.org](https://ember-energy.org) made with python matplotlib. I can put the code up if anyone wants it.
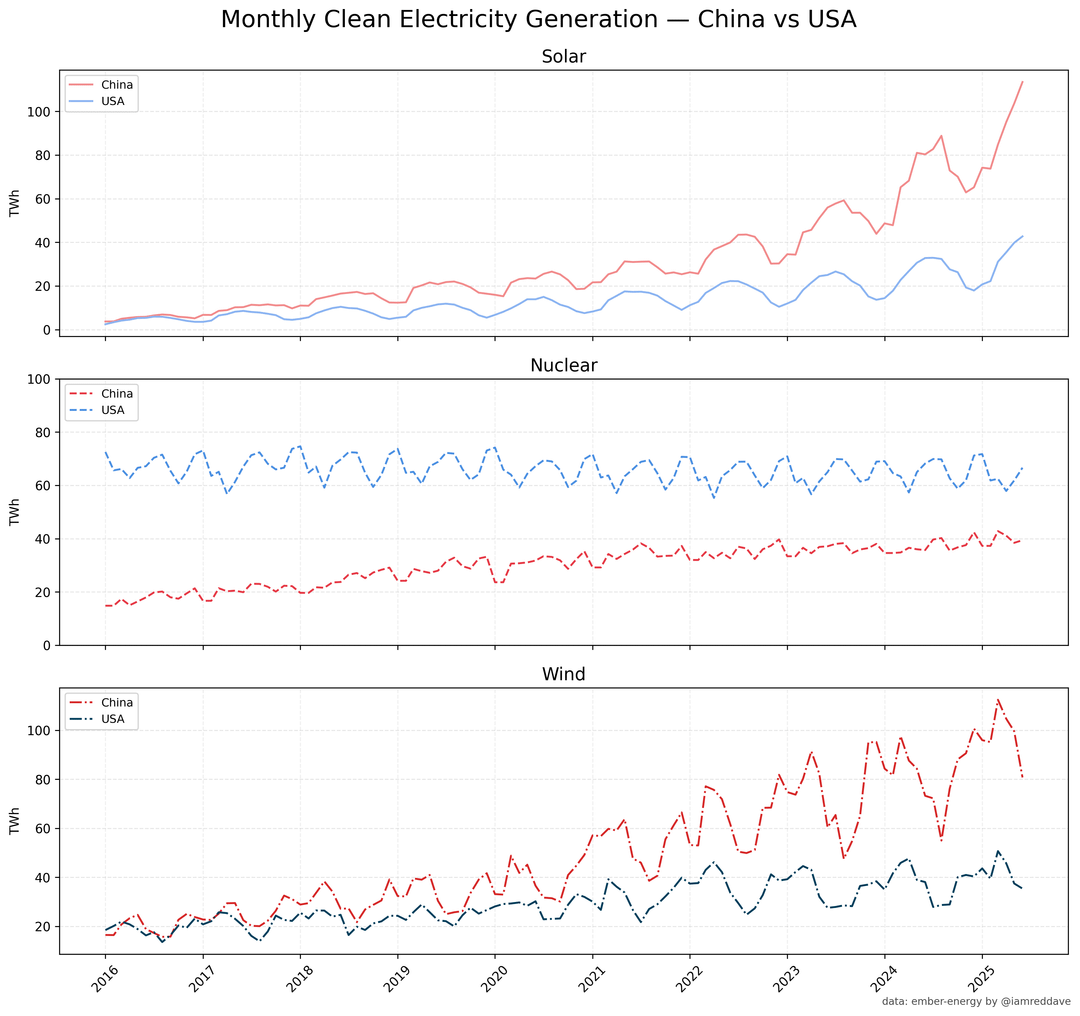
China is adding Solar really fast. But what that means in the context of their coal usage is a reasonable question. And these graphs I made to try give a view on that.
I posted this a few minutes ago but green graph did not mention monthly and the y axis for nuclear was different. Thanks to the earlier voters and sorry for my mistake.
Can we get a stacked line graph for each country, and then a combined one? TWh is great, but doesn’t capture change in proportion to overall usage very well.
I don’t understand the obsession with this. They have more people, more industry and their co2 emissions keep growing. China are exactly the country who should be installing lots of renewables. Why does anyone care?
Why the sinusoidal fluxuations?
What’s really cool here is the proportion of renewable energy over time – looks to be about a third in both countries and increasing! Incredible change from renewables being a rounding error in previous decades
For those asking about the consistent, sinusoidal nature to the nuclear energy output within the United States despite our reactors being run at base load, there is one primary reason. Nuclear reactors need to refuel (typically every 2 years) and this is generally done in the spring and fall while the weather is cool and energy demand is lower. During refueling, there is no power output from that reactor.
Outside of refueling, reactors will ideally run non-stop barring trips or maintenance outages to resolve equipment issues.
For solar, the dips correspond with winter. China and the United States are in the northern hemisphere and the sunlight is less direct during that time as well as having less daylight hours. Thus, solar is less effective.
For wind, output is less in the summer due to less variable temperatures which lower the consistency of wind. I’m not sure if lower air density plays a role or not, but hypothetically, lower air density due to increased temperatures would exert less force on turbine blades.
A graph showing the need/usage would be useful. Consider that China has > 4x the population of the US, this could be just providing basic electricity to half of their population.
We are going to be left in the dust by China, thanks to El Cheeto
The US could cease to exist and that would only bring combined coal use between the US & China down to China’s level a few years ago. This is why the fight against climate change is over, and corporations won.
Impressive that they’ve doubled nuclear generation over ten years. The leap in solar and wind is just amazing.
I wonder how they have done with hydro?
Global emissions have peaked thanks to China’s solar adoption
The cost of solar continues to drop, and is beginning to go below most other energy sources
The future is bright (haha)
This set of graphs, IMHO, is the most important piece of information to understand why the USA is falling behind China in growth…
Energy is *everything*. The food you are eating? Diesel farm equipment and fertilizer made from natural gas, and trucks powered by (diesel or perhaps EV going into the future) are why it’s in the supermarket.
The websites you are using? energy.
The netflix videos? energy.
The theme parks? energy.
Manufacturing? energy.
IMHO: the USA needs to rapidly begin growing Nuclear and Solar as fast as possible, as soon as possible – or risk falling behind forever.
China also has about 4x the population at 1.4 billion, USA has about 340 million. So yes, China may be ‘beating’ the States in total but not per capita.

13 comments
Data from [https://ember-energy.org](https://ember-energy.org) made with python matplotlib. I can put the code up if anyone wants it.
China is adding Solar really fast. But what that means in the context of their coal usage is a reasonable question. And these graphs I made to try give a view on that.
I posted this a few minutes ago but green graph did not mention monthly and the y axis for nuclear was different. Thanks to the earlier voters and sorry for my mistake.
Can we get a stacked line graph for each country, and then a combined one? TWh is great, but doesn’t capture change in proportion to overall usage very well.
I don’t understand the obsession with this. They have more people, more industry and their co2 emissions keep growing. China are exactly the country who should be installing lots of renewables. Why does anyone care?
Why the sinusoidal fluxuations?
What’s really cool here is the proportion of renewable energy over time – looks to be about a third in both countries and increasing! Incredible change from renewables being a rounding error in previous decades
For those asking about the consistent, sinusoidal nature to the nuclear energy output within the United States despite our reactors being run at base load, there is one primary reason. Nuclear reactors need to refuel (typically every 2 years) and this is generally done in the spring and fall while the weather is cool and energy demand is lower. During refueling, there is no power output from that reactor.
Outside of refueling, reactors will ideally run non-stop barring trips or maintenance outages to resolve equipment issues.
For solar, the dips correspond with winter. China and the United States are in the northern hemisphere and the sunlight is less direct during that time as well as having less daylight hours. Thus, solar is less effective.
For wind, output is less in the summer due to less variable temperatures which lower the consistency of wind. I’m not sure if lower air density plays a role or not, but hypothetically, lower air density due to increased temperatures would exert less force on turbine blades.
A graph showing the need/usage would be useful. Consider that China has > 4x the population of the US, this could be just providing basic electricity to half of their population.
We are going to be left in the dust by China, thanks to El Cheeto
The US could cease to exist and that would only bring combined coal use between the US & China down to China’s level a few years ago. This is why the fight against climate change is over, and corporations won.
Impressive that they’ve doubled nuclear generation over ten years. The leap in solar and wind is just amazing.
I wonder how they have done with hydro?
Global emissions have peaked thanks to China’s solar adoption
https://www.weforum.org/stories/2025/06/clean-energy-china-emissions-peak/
The cost of solar continues to drop, and is beginning to go below most other energy sources
The future is bright (haha)
This set of graphs, IMHO, is the most important piece of information to understand why the USA is falling behind China in growth…
Energy is *everything*. The food you are eating? Diesel farm equipment and fertilizer made from natural gas, and trucks powered by (diesel or perhaps EV going into the future) are why it’s in the supermarket.
The websites you are using? energy.
The netflix videos? energy.
The theme parks? energy.
Manufacturing? energy.
IMHO: the USA needs to rapidly begin growing Nuclear and Solar as fast as possible, as soon as possible – or risk falling behind forever.
China also has about 4x the population at 1.4 billion, USA has about 340 million. So yes, China may be ‘beating’ the States in total but not per capita.
Comments are closed.