Study design
The study type is a multi-centre, observational prospective (open) cohort study, analysed in a quasi-experimental (interrupted time series, ITS) design21. We use months per centre as observation units, which are obtained from a retrospective (open) cohort of health surveillance data from the Pri.CareNet surveillance network. The impact of COVID-19 on incident diagnosis patterns among refugees was evaluated using a segmented regression approach.
Setting and data sources
The analysis was conducted within the framework of Pri.CareNet, a health surveillance network20. Pri.CareNet is overseen by the University Hospital Heidelberg and comprises healthcare providers operating healthcare facilities on-site as of October 2018. Since December 2023, these facilities are distributed across 24 state-level registration and reception centres, along with one district-level accommodation centre for refugees in Germany. These 25 centres are situated in the German states of Baden-Wuerttemberg, Bavaria, and Hamburg. These states collectively host approximately 30% of the asylum-seeking population in Germany, as determined by administrative quotas46.
Asylum-seekers are obliged to stay in the reception centres for up-to 18 months or longer before they are transferred to district-level accommodation centres. Asylum-seekers from presumed safe countries of origin must stay in the centres until the end of their asylum process, but maximum for 24 months. The duration of stay can hence vary considerably depending on stocks and flows, countries of origin, federal state regulations and processes, and the speed of the asylum process. In Baden-Wuerttemberg, state level authorities report an average duration of stay between 8 and 18 weeks, but underlying source data are not public and cannot be validated independently. Other states do not report average durations of stays within centres on a routine basis.
Most reception centres provide on-site health care facilities. These are usually equipped to provide basic primary care services within a heterogeneous infrastructure and with a varying quality, while some centres provide additional services ranging from specialist care to psychosocial services27,47.
Measures in response to the pandemic comprised decongestion, mass quarantine, as well as reduction of health, social, and other service. Although measures were implemented in a heterogenous way across the country11,14, the system of centralized reception remained operational, and reception centres were not closed or shut down in favor of decentralized housing5.
Within Pri.CareNet, healthcare providers are equipped with a customized Electronic Health Record (EHR) system known as Refugee Care Manager (Ref.Care). Ref.Care not only includes standard medical record-keeping features but also incorporates a built-in, federated health surveillance module developed at Heidelberg University Hospital20,48. The surveillance module comprises an automated analysis of locally stored medical routine data using predefined indicators. The indicators are constructed using diagnosis categories based on International Classification of Diseases (ICD-10-GM Version 2021) and drug prescriptions based on the Anatomic Therapeutic Classification (ATC 2023) as defined and outlined in Table 2, and operationalized through a standardised analysis script20,48. Indicators were developed and consented within the consortium by practitioners, healthcare providers, and authorities in a collaborative research approach. To protect data anonymity, any observations with counts less than 3 are adjusted to 0. More detailed information about the surveillance infrastructure in Pri.CareNet, and the local analysis of indicators can be found in previous reports20,48.
Table 2 Indicator definitions based on diagnoses (ICD-10 Codes) and prescriptions (ATC-Codes) recorded in the electronic health record
The data used in this paper was generated using Ref.Care version 1.1.8 (ref.care) and covers the time span from October 2018 to April 2023. The facilities included in this study joined the surveillance network at different dates (Supplementary Chapter 3). Some centres have since departed from the network due to closures or changes in healthcare providers, but still contributed their anonymous health surveillance data for the purpose of this study. Provided data consequently varies per centre (Supplementary Chapter 3).
Ref.Care is used by health professionals, who are the data holders of the individual-level patient data in on-site health care facilities. They enter the medical data into the EHR as part of their routine clinical work, so that no parallel data entry effort is required. Data entry fields are both standardized and allow for free texts (e.g., for medical history), but all data used in this analysis is based on standardized codes and diagnoses (see below). The respective authorities in the three federal states are responsible for immigration data, and are data holders of the occupancy data, i.e., the sociodemographic information of the refugee centres’ inhabitants.
The flowchart in Fig. 8 provides an overview of the data selection process, the nature of used data sources and the four derived data subsets (Subset 1–4).
Fig. 8: Flow Chart with overview of sites and settings, data sources, and derived datasets for analyses.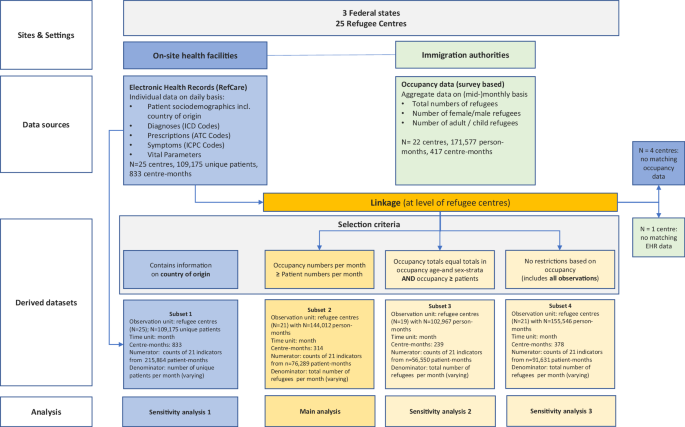
Ref.Care Refugee Care Manager, ICD-10 International Classification of Disease, ATC Anatomical Therapeutic Chemical Classification, ICPC International Classification of Primary Care, EHR electronic health records.
Individuals are included in the medical records if they seek care in one of the on-site medical clinicals established for refugees, so that data are “utilisation data”, which means that health data of individuals who did not seek care is not included. Individuals may also seek care outside of reception centres, but this usually requires approval, and is linked to several geographic, linguistic and administrative barriers, which is why on-site services usually constitute a low-threshold and first anchor point for patients seeking care. In case of serious and chronic conditions, data of referrals or re-referrals to providers of the regular health system are recorded in Ref.Care in the refugee centres as well to ensure ongoing treatment, so that medical history can regarded as fairly complete. However, it cannot be ruled out that major diagnoses have been not recorded in case of treatment outside of the facilities in the regular health system.
Electronic health records (Ref.Care) data set (subset 1)
Using the 25 refugee centres and months as units of analysis, subset 1 contains 833 observations (i.e., 833 “centre-months”) of recorded medical data with an average of \({{mean}}(n_{{pat}})=259\) (1) (standard deviation \({sd}({n}_{{pat}})=287\)) (2) patient-months. The sample comprised 215.864 patient-months (\(={\sum }_{i=1}^{833}{n}_{{pat}}^{i}\), (3) where \({n}_{{pat}}^{i}\) is the number of refugee patients of “centre-month” i) of a total of 109.175 refugee patients between October 2018 and April 2023 (Fig. 8). For these 833 centre-months, we used reported monitoring data on the number of male, female, adult (≥ 18 years of age) and underage (3.3). As differences appeared marginal (difference in means: 1.0 year, standard deviation 1.7), we used age as dichotomous variable (proportion of adults: ≥18 years and proportion of children: ≤18 years) in the regression models.
Furthermore, in Sensitivity analysis 1, we used data on the country of origin of the patients from the EHR to run models which account for compositional differences in the refugee population within and between refugee centres over time (Supplementary Chapter 2.1). Estimates for the COVID-19 impact from this sensitivity analysis are reported in Fig. 2.
Occupancy data and aggregate-level socio-demographics
Furthermore, we gathered information on occupancy of each refugee centre within the Pri.CareNet surveillance network through a monthly online survey conducted with the responsible authorities of these centres. This prospective census survey was initiated in October 2018 and encompasses count data concerning the number of residents on the 15th day of each respective month, categorized by age (adults: ≥ 18 years and children: ≤ 18 years), and biological sex (male/female) (Fig. 8). To determine the total occupancy of each centre for every month, we combined the reported counts of male and female adults separately for the adult population and likewise for the children. These cumulative counts of children and adults were then summed to calculate the total occupancy for each centre and month. Furthermore, the overall (unstratified) number of the occupancy was collected.
Participation of authorities in this survey is voluntary. We collected occupancy data from 22 centres, resulting in a comprehensive dataset covering 417 centre-months spanning from October 2018 through June 2023 (Fig. 8). The average occupancy stands at \({{mean}}(n_{{occ}})=411\) (4) individuals per centre per month, with a standard deviation of \({sd}\left({n}_{{occ}}\right)=435\) (5).
Description of derived datasets and variables
We matched the EHR data with the monthly occupancy data for each centre, wherever possible (Fig. 8). In 64 cases, the occupancy count was lower than the number of patients (i.e., \({{{{\rm{n}}}}}_{{{{\rm{occ}}}}} ) (6). This occurrence is reasonable in situations where refugee centres experience a rapid turnover of individuals, such as a high influx of new arrivals and frequent transfers. In such instances, individuals may seek on-site healthcare services but stay within the centres for only a brief period, leading to a temporary misalignment between occupancy figures and the number of patients receiving healthcare services. These observations were excluded for the main analysis which resulted in a total of 314 centre-months between October 2018 and April 2023 of 21 centres (with \({{mean}}(n_{{pat}})=243\) (7), \({sd}\left({n}_{{pat}}\right)=240\) (8), \({{mean}}(n_{{occ}})=459\) (9) and \({sd}\left({n}_{{occ}}\right)=462\) (10); subset 2).
In 75 cases, the sum of the reported strata counts (female/male x adult/children) did not equal the reported total occupancy. Therefore, we repeated the main analysis on subset 3 (Sensitivity analysis 2), where the occupancy totals equal the totals in occupancy age-and sex-strata AND \({{{{\rm{n}}}}}_{{{{\rm{occ}}}}}\ge {{{{\rm{n}}}}}_{{{{\rm{pat}}}}}\) (11) (Supplementary Chapter 2.2). Furthermore, in Sensitivity analysis 3, we repeated the main analysis again (which was performed on subset 2), but instead used subset 4 of the linked data, which contained no restrictions, i.e., all observations of the linked dataset (Supplementary Chapter 2.3).
Furthermore, we calculated the following variables (for each subset, respectively):
– time: discrete variable indicating time from the start up to the end of the observation period October 2018 to April 2023 with time ID = {1, …, 56} (12)
– covid: coded 0 for pre-covid time points and 1 for post-covid time points (0:
– postslope: coded 0 up to the last point before COVID-19 and coded sequentially from 1 thereafter (0:
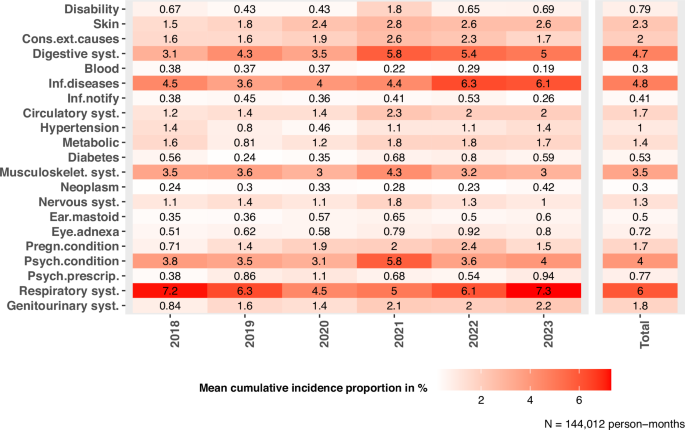
It should be noted that there are two levels in the data: months and centres. As a result, there are multiple observations of these levels per year. Therefore, in order to report the mean incidence of analysed outcomes (Table 1), we determined weighted mean values averaging over the months for each facility per year, so that there is only one observation per year of a facility. The weighting was based on nocc, i.e., months with high occupancy were assigned a higher weighting when calculating the weighted mean incidence for each facility (“weighted mean facility observation”). Table 1 shows the mean value with standard deviation (mean ± sd), median with 25th and 75th quartiles (Q1, Q3), minimum and maximum (min–max) and 95% confidence interval (CI) weighted mean values of facility observations. Furthermore, the annual weighted mean value and weighted standard deviation are given, whereby the weighting was accordingly to the mean occupancy of a facility within one year. That is, if the mean occupancy of a facility in one year is higher, the observation weighs more (“weighted annual”: mean and standard deviation of the “mean facility observation” values within one year weighted by the mean occupancy of the respective facility; compare row W, 2018–2023). Additionally, the mean value and the standard deviation of the weighted annual mean values were calculated (row W, last column). Indicators with very few observations per centre-month (e.g., congenital disorders, multimorbidity) were excluded from the analysis to avoid problems with convergence and fitting of regression models.
We implemented additional sensitivity analyses with the attempt to capture and evaluate nuances during the peri-pandemic phase beyond a dichotomous approach described above.
In Sensitivity analysis 4, we implemented a more fine-grained analysis that distinguishes three phases of the pandemic:
-Pre-pandemic phase (before 02/2020)
-Phase 1 of the pandemic: representing the early phase until the onset of vaccine availability, i.e., 02/2020–07/2021
-Phase 2 of the pandemic: Emerging variants phase (e.g., delta, omicron, etc.) and increasing vaccine role out, i.e., 08/2021 to 04/2023
The results are presented in Supplementary File, Chapter 5 (Fig. S26).
In Sensitivity analysis 5, we have implemented an analysis to examine seasonality effects, comparing effects of spring, autumn, and winter periods with summer periods (2018–2023), respectively. The results are presented in Supplementary File, Chapter 5 (Fig. S27), showing that seasonality effects exist in particular for consequences of external causes of injuries, with higher incidences in summer periods compared to spring, winter and autumn, respectively. This may be due to route dependent effects (more dangerous routes during summer), heat related effects on violence, or higher probability of injuries related to outdoor activities. The incidence of psychological conditions was higher in winter periods (compared to summer periods), while respiratory conditions were significantly higher in winter and autumn (compared to summer periods). No considerable seasonality effects were observed for the remainder of diagnoses. The patterns prove the high plausibility of the surveillance data, and are overall consistent with the patterns observed in the main analysis.
Description of the regression model
In order to assess the impact of the COVID-19 pandemic on the incident health indicators, we fitted a negative binominal model with zero-inflation model on the matched data for each indicator. The model allows the conditional mean to depend on the percentage of adult and male occupancy, overall number of occupancy (nocc) as well as randomly on centres, while β0 captures the baseline level of the outcome at time 0 (beginning of the observation period), βtime estimates the structural trend or growth rate, independently from COVID-19, βcovid estimates the immediate impact of COVID-19 or the change in the outcome of interest after COVID-19 and βpostslope reflects the change in the trend or growth rate in the outcome after COVID-19. Furthermore, the model assumes structural zeros (Supplementary Chapter 1). The model can be represented by the following set of equations:
$${{{\rm{\mu }}}}={{{\rm{E}}}}\left({{{\rm{count}}}},|,u,{{{\rm{NSZ}}}}\right)=\exp \left({{{{\rm{\beta }}}}}_{0}+{{{{\rm{\beta }}}}}_{{{{\rm{adult}}}}}+{{{{\rm{\beta }}}}}_{{{{\rm{male}}}}}+{{{{\rm{\beta }}}}}_{{{{{\rm{n}}}}}_{{{{\rm{occ}}}}}}+\,{{{{\rm{\beta }}}}}_{{{{\rm{time}}}}}+{{{{\rm{\beta }}}}}_{{{{\rm{covid}}}}}+{{{{\rm{\beta }}}}}_{{{{\rm{postslope}}}}}+u\right),$$
(13)
$$u{{{\mathscr{ \sim }}}}{{{\mathscr{N}}}}(0,\,{\sigma }_{u}^{2}),$$
(14)
$${{{{\rm{\sigma }}}}}^{2}={{{\rm{Var}}}}\left({{{\rm{count}}}} | u,{{{\rm{NSZ}}}}\right)={{{\rm{\mu }}}}\left(1+\frac{{{{\rm{\mu }}}}}{{{{\rm{\theta }}}}}\right),$$
(15)
$${{{\rm{logit}}}}({{{\rm{p}}}})\,=\,{{{{\rm{\beta }}}}}_{0}^{({{{\rm{zi}}}})}$$
(16)
where u is a centre specific random effect, NSZ is the event “non-structural zero”, \({{{\rm{p}}}}=1-\Pr ({{{\rm{NSZ}}}})\) (17) is the zero-inflation probability and β’s are the regression coefficients with subscript denoting the covariate and with 0 denoting the intercept49. The chosen parameterization of the negative binomial uses a logarithmic link and denotes the variance increasing quadratically with the mean as \({{{{\rm{\sigma }}}}}^{2}={{{\rm{\mu }}}}(1\,+{{{\rm{\mu }}}}/{{{\rm{\theta }}}})\) (18), with \({{{\rm{\theta }}}} > 0\) 50 (19) (Supplementary Chapter 1).
Counterfactual analysis
We performed a counterfactual analysis by predicting the expected values of the 21 health indicators given that the pandemic had not happened (variable covid set at “0”) while considering the socio-demographic characteristics of the underlying refugee population in respective centres and time periods. We plotted the estimated counterfactual, observed, and expected incidence rates in percent (i.e., the number of cases divided by occupancy and multiplied by 100) of selected indicators together in box plots over the observation period (compare Figs. 3–7).
Sex and gender considerations
Sex is based on data coded in routine medical records (based on physicians’ coding), gender was not captured or available. Sex was considered in the analyses as co-variable in regression models. Differential effects of the pandemic between men and women were not analysed. Sex-stratified descriptive data of all outcomes are available in the Supplementary Material.
Race, ethnicity and other social categories of the study population
No variables of race or ethnicity were used. Country of origin, i.e., nationality recorded in the medical records system, was used in the regression models to adjust for differences in incident diagnoses that may be attributable to compositional changes of the underlying refugee population in a centre, rather than to the analysed exposure (COVID-19 pandemic). Nationalities included in the analyses were restricted to those countries with the most frequent share among the refugee population across all centres (Afghanistan, Iraq, Nigeria, Syria, Turkiye). We use the social category refugee in our manuscript and the analysis, acknowledging that this category subsumes a heterogenous population. We further use this term as umbrella term for persons who are registered in the centres and live there with different residence status as asylum claimants, asylum seekers, resettlement refugees, accepted refugees, or tolerated individuals. As our data is based on medical records data, no information was available for the different residence status to allow for more nuanced dis-aggregation, or in order to evaluate and assess any within-group variations among the social category of refugees. The study population did not contain general migrants, but was confined to refugees living in camp-like or institutionalised accommodation facilities (reception centres).
Statistical software
All analyses were conducted in the R-programming language version 4.2.1 using the glmmTMB-package50 for fitting mixed-effects models.
Ethics
The study uses de-individualised anonymous (aggregate) data, generated from a federated data analysis methodology performed on individual-level clinical data with the result of anonymous counts. The methodology and implementation of the data protection approach for federated data analysis has been reviewed and approved by the Review Board of the Technology and Methods Platform for Networked Medical Research (TMF e.V.). The study has been additionally reviewed and approved by the Ethics Board of the Medical Faculty of Heidelberg University (S-646/2024).
Reporting summary
Further information on research design is available in the Nature Portfolio Reporting Summary linked to this article.