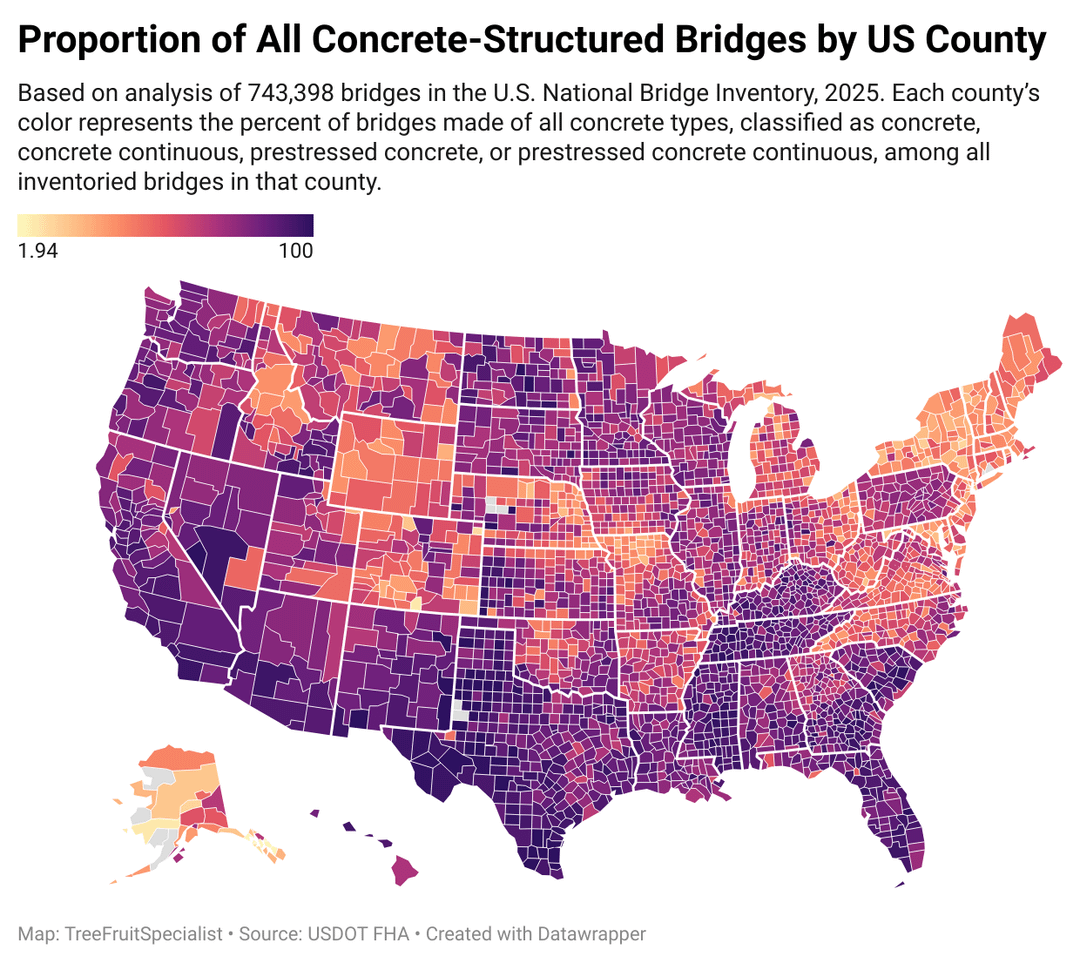
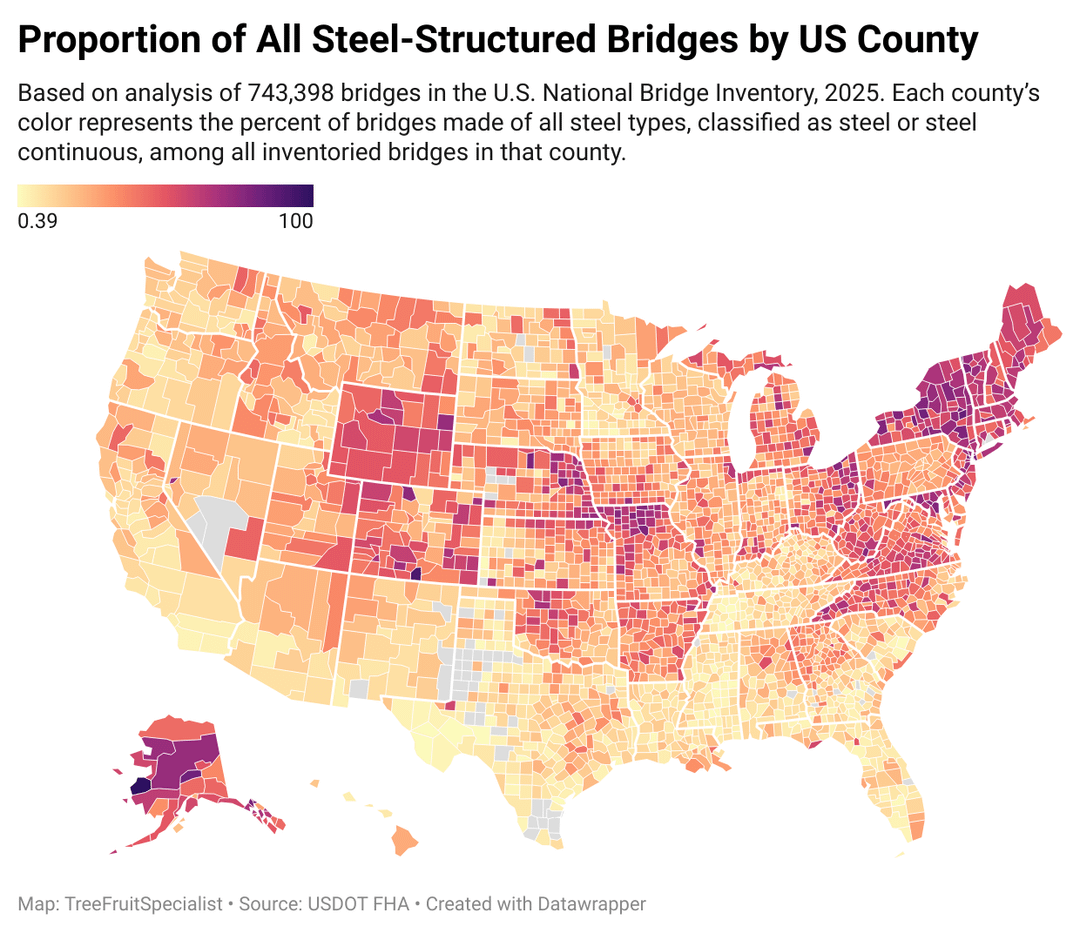
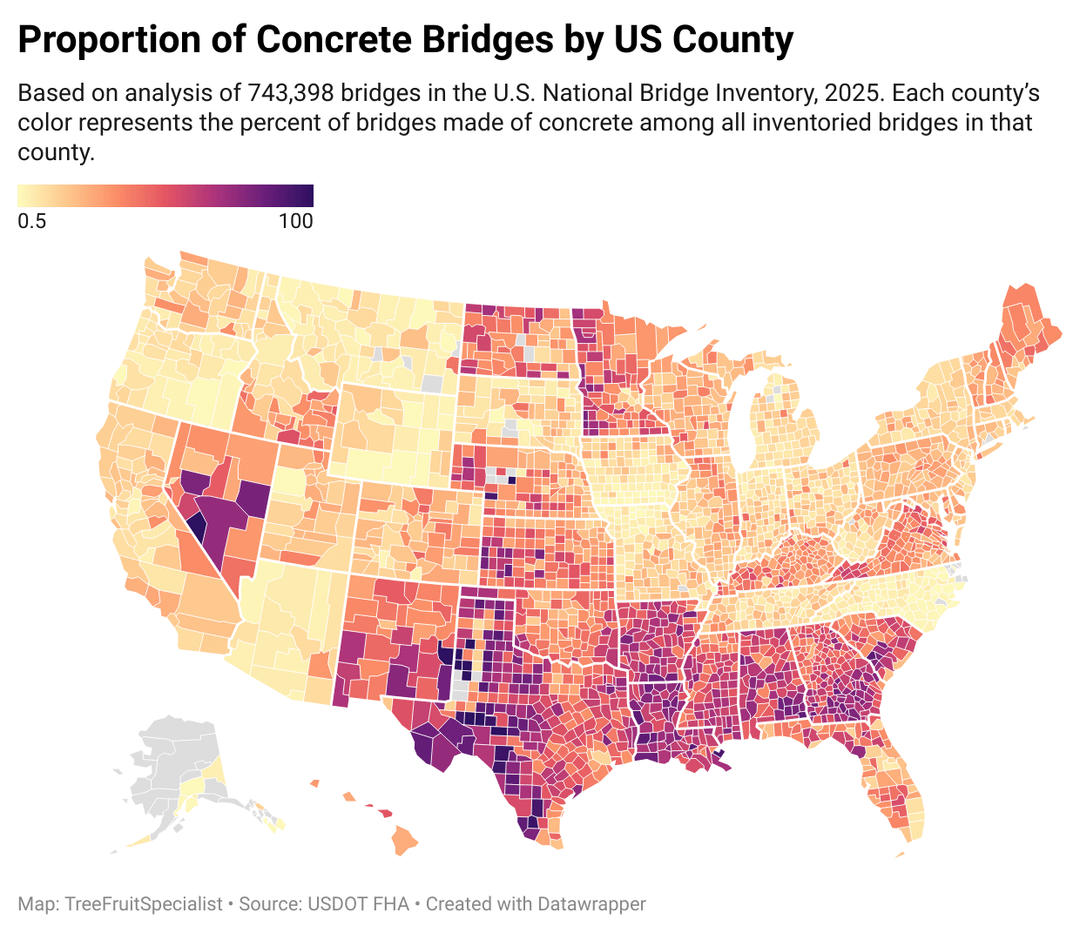
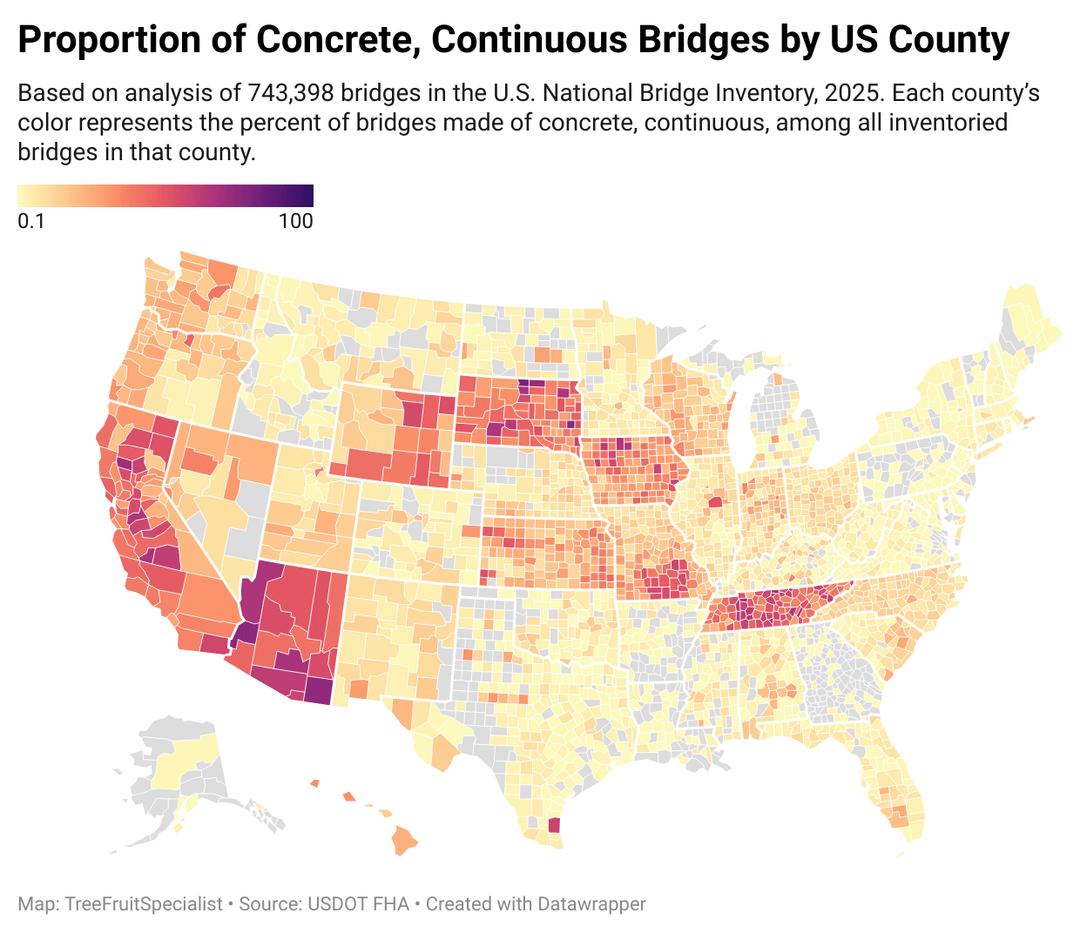
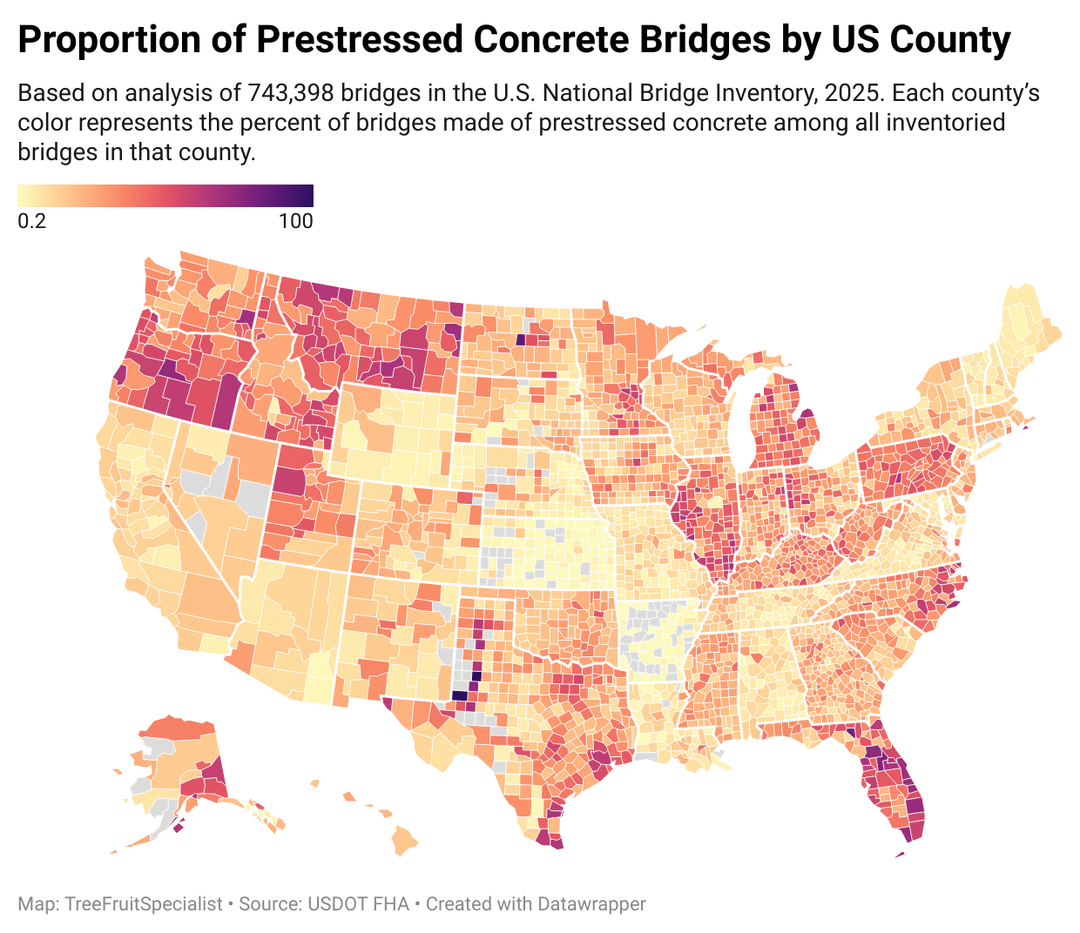
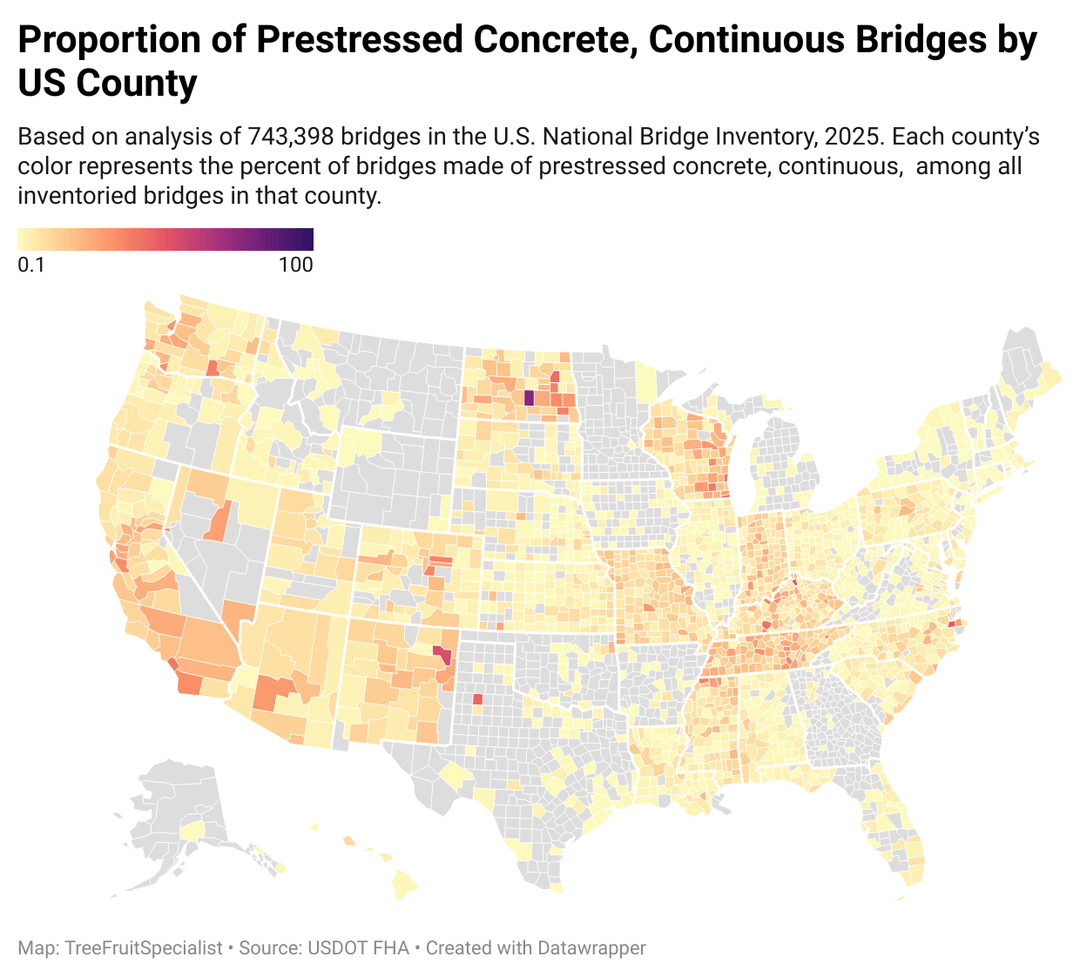
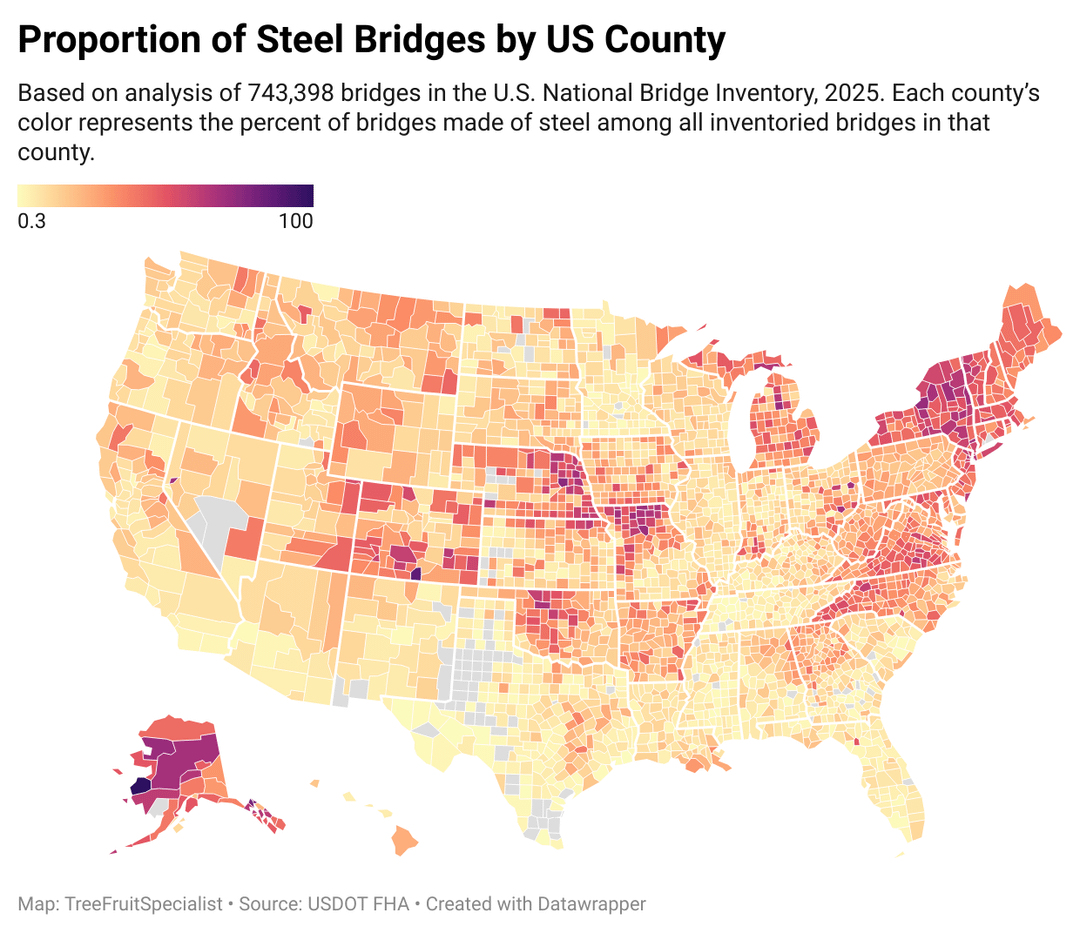
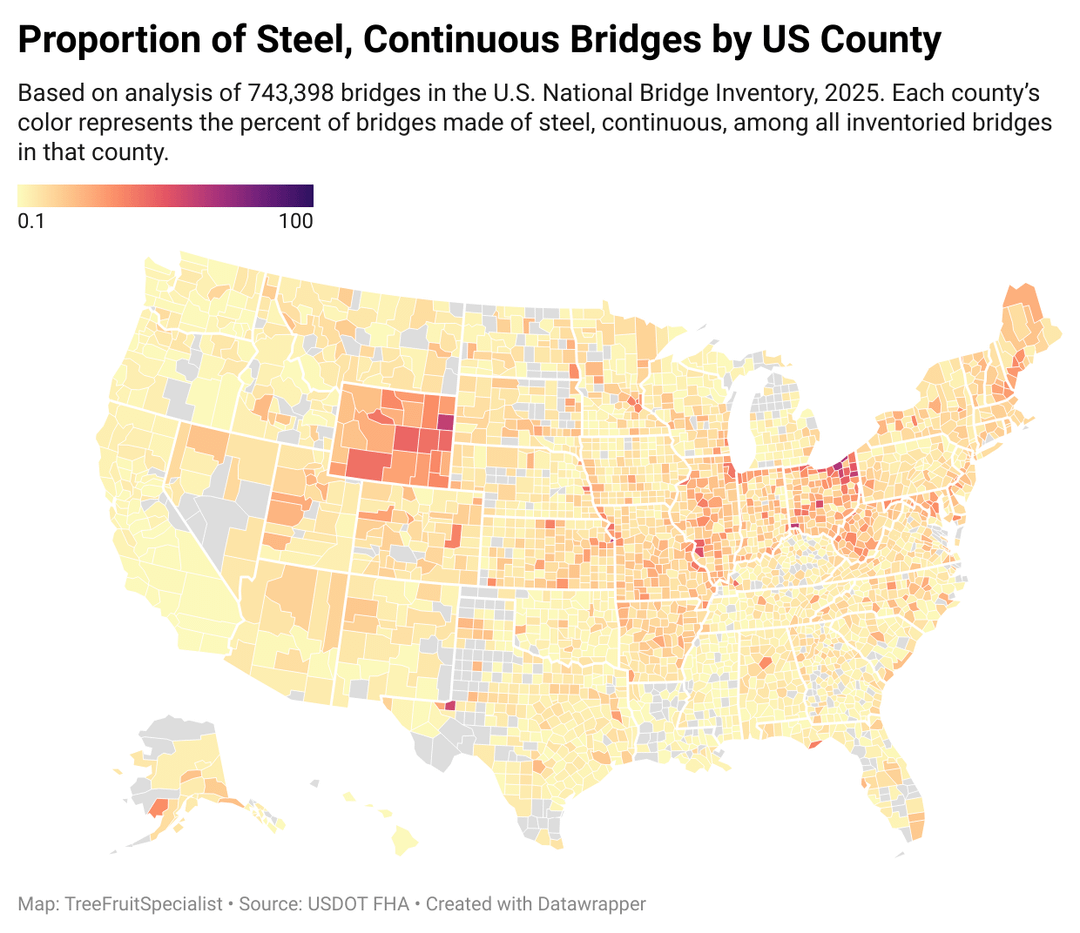
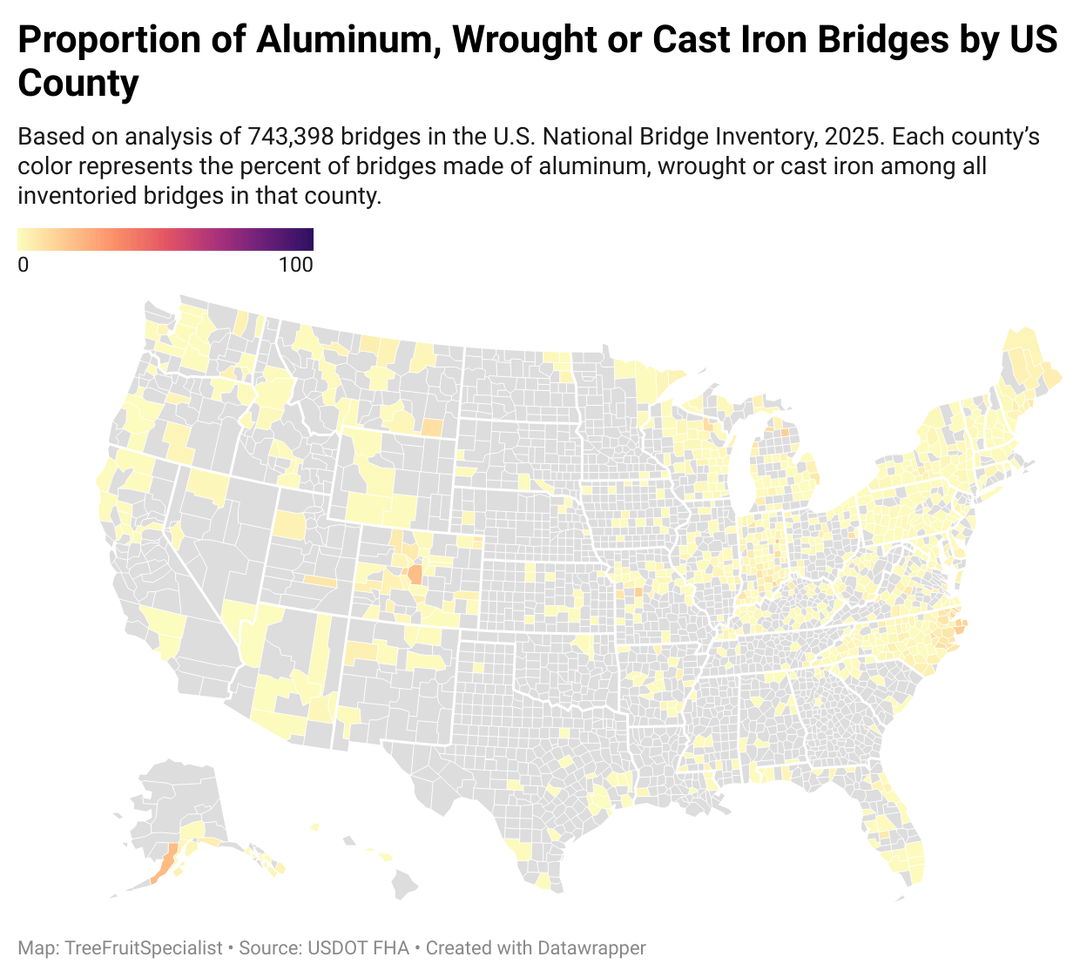
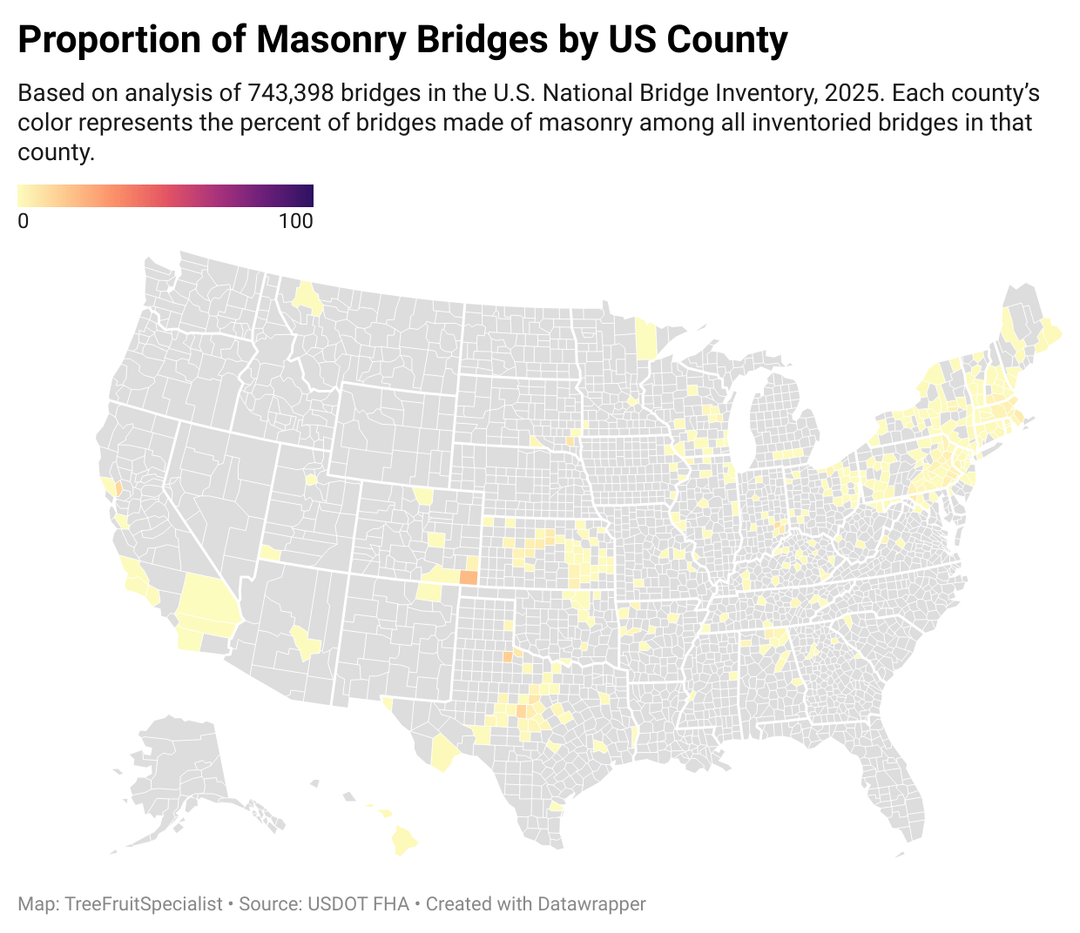
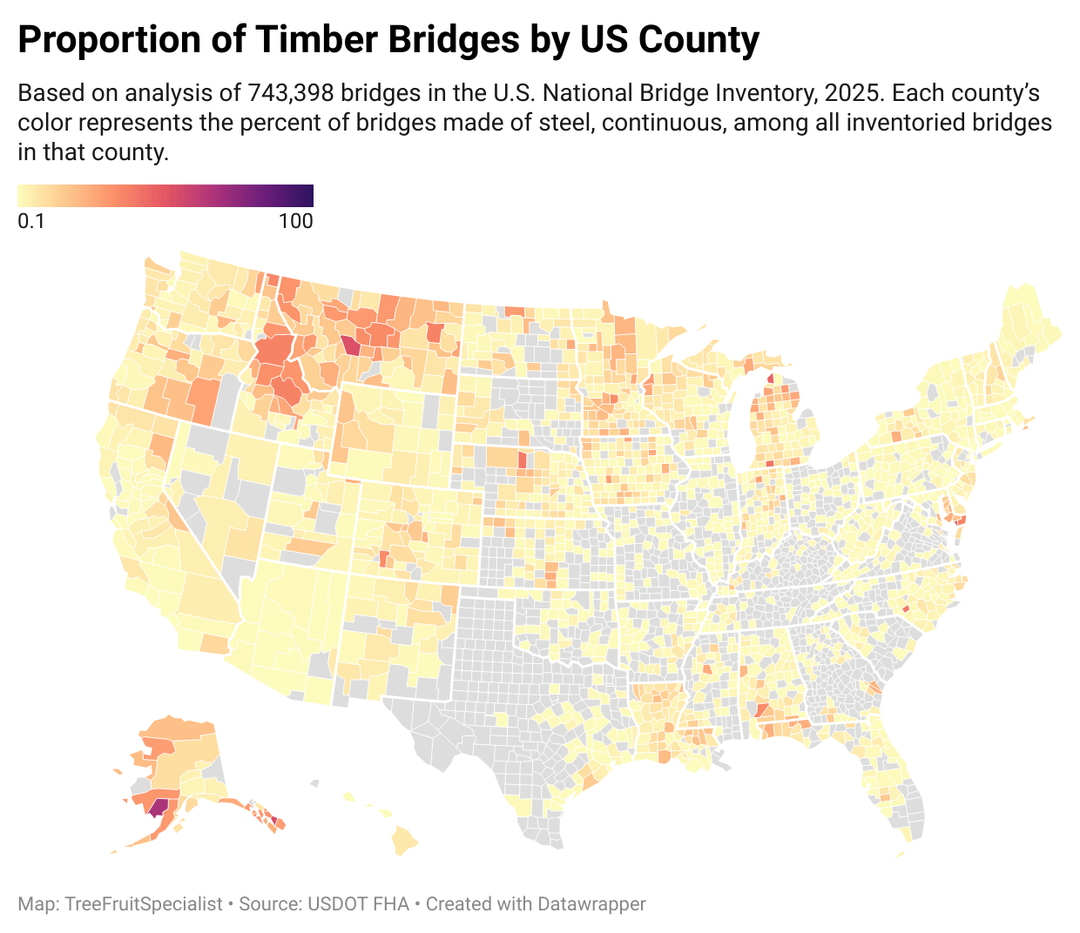
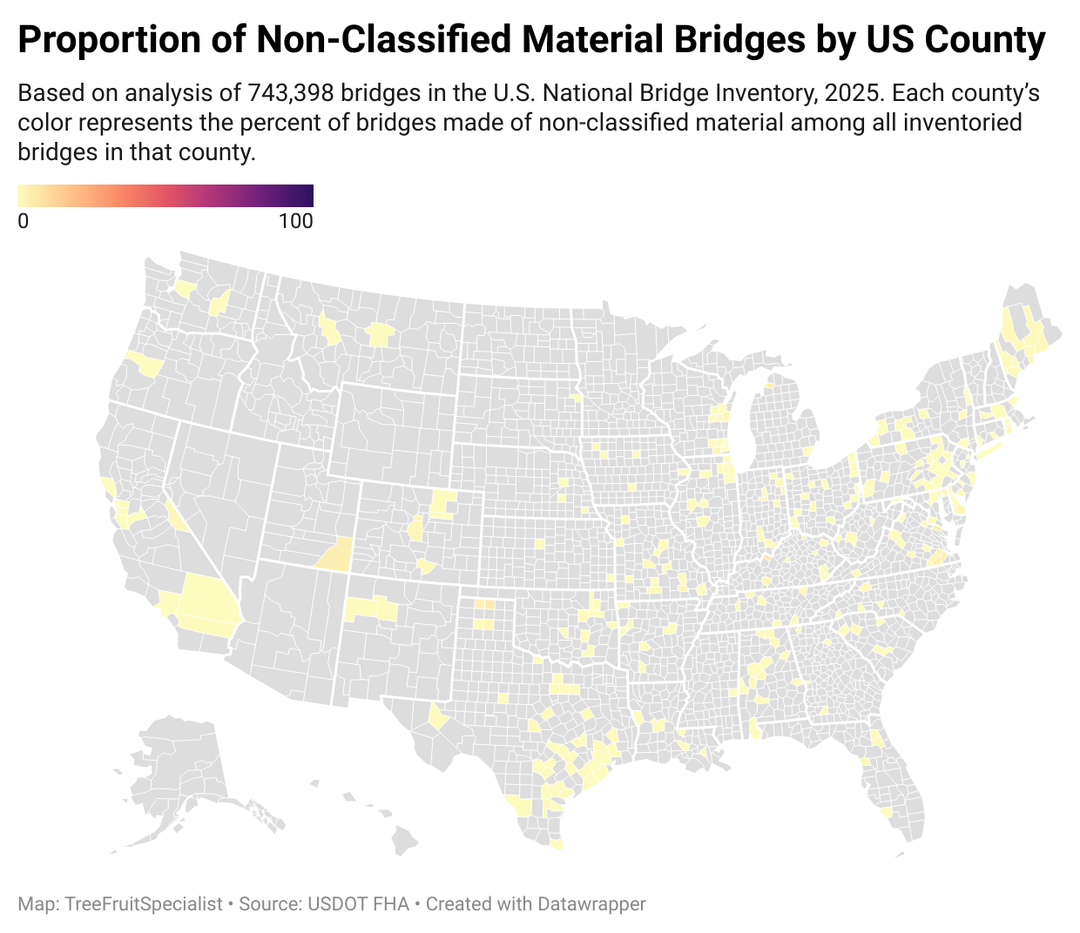
[OC] Using the 2025 U.S. National Bridge Inventory, I mapped the proportion of different bridge structural materials at the county level across the U.S. Each map shows the percentage of bridges within a county that are constructed using a specific material type.
I processed the dataset in R, calculated material proportions by county, and visualized the results using Datawrapper.
One map for each of the 10 distinct structure materials.
Each bridge is assigned a material/design code in the datafile. Here’s the mapping:
0 – Other
1 – Concrete
2 – Concrete, Continuous
3 – Steel
4 – Steel, Continuous
5 – Prestressed Concrete
6 – Prestressed Concrete, Continuous
7 – Timber
8 – Masonry
9 – Aluminum, Wrought Iron or Cast Iron
**What Qualifies as a Bridge in the NBI?**
A structure is classified as a bridge and included in the NBI if it meets both of the following criteria:
Function: It must carry traffic (vehicular or pedestrian), or span over traffic routes (like roads, railways, or navigable waterways). Snowmobile paths are generally not counted unless maintained year-round.
Size: It must have a total span length greater than 20 feet (6.1 meters) over the feature it crosses.
This means from abutment to abutment or bearing to bearing.
Structures shorter than 20 feet may still exist in datasets, but they are not subject to federal inspection requirements or NBI reporting unless part of a grouped structure.
edit: Removed ‘Continental’, these maps include AK and HI
I really love a good colormap that suites the data it represents.
The update we were all waiting for
Shoutout to to those counties in Nebraska that are just “whats a bridge?”
Can you explain how in your original post, San Deigo County (and all of california really) was mostly steel, but is now nearly 100% concrete in this post? Was it a data ingestion error?
You need to remove all of the “under” records in the dataset (Item 5a <> 1) to get the correct overall inventory. You should end up with something like 620k-625k bridges if using the 2025 data set.
Under records are partial sub-records of routes going under an overpassing bridge. Their primary purpose is to record clearance information and may or may not contain structure type information. If it does, it would duplicate the data from the “over” record so it’s best to remove them to get accurate inventory data.
You can use FHWA’s InfoBridge site (https://infobridge.fhwa.dot.gov/Data) to check your findings though it looks like it hasn’t yet been updated with the 2025 data yet.
On mouseover, would it be possible to display the counts of the bridges?
Thank you for chart 11/12, proportion of timber bridges by county. On the original post, i thought immediately of south central Oregon of a week i spent visiting all the wooden covered bridges.
8 comments
[OC] Using the 2025 U.S. National Bridge Inventory, I mapped the proportion of different bridge structural materials at the county level across the U.S. Each map shows the percentage of bridges within a county that are constructed using a specific material type.
I processed the dataset in R, calculated material proportions by county, and visualized the results using Datawrapper.
There are 12 maps total:
**All Concrete Bridges** (includes types 1, 2, 5, 6)
**All Steel Bridges** (includes types 3 and 4)
One map for each of the 10 distinct structure materials.
Each bridge is assigned a material/design code in the datafile. Here’s the mapping:
0 – Other
1 – Concrete
2 – Concrete, Continuous
3 – Steel
4 – Steel, Continuous
5 – Prestressed Concrete
6 – Prestressed Concrete, Continuous
7 – Timber
8 – Masonry
9 – Aluminum, Wrought Iron or Cast Iron
**What Qualifies as a Bridge in the NBI?**
A structure is classified as a bridge and included in the NBI if it meets both of the following criteria:
Function: It must carry traffic (vehicular or pedestrian), or span over traffic routes (like roads, railways, or navigable waterways). Snowmobile paths are generally not counted unless maintained year-round.
Size: It must have a total span length greater than 20 feet (6.1 meters) over the feature it crosses.
This means from abutment to abutment or bearing to bearing.
Structures shorter than 20 feet may still exist in datasets, but they are not subject to federal inspection requirements or NBI reporting unless part of a grouped structure.
edit: Removed ‘Continental’, these maps include AK and HI
I really love a good colormap that suites the data it represents.
The update we were all waiting for
Shoutout to to those counties in Nebraska that are just “whats a bridge?”
Can you explain how in your original post, San Deigo County (and all of california really) was mostly steel, but is now nearly 100% concrete in this post? Was it a data ingestion error?
You need to remove all of the “under” records in the dataset (Item 5a <> 1) to get the correct overall inventory. You should end up with something like 620k-625k bridges if using the 2025 data set.
Under records are partial sub-records of routes going under an overpassing bridge. Their primary purpose is to record clearance information and may or may not contain structure type information. If it does, it would duplicate the data from the “over” record so it’s best to remove them to get accurate inventory data.
You can use FHWA’s InfoBridge site (https://infobridge.fhwa.dot.gov/Data) to check your findings though it looks like it hasn’t yet been updated with the 2025 data yet.
On mouseover, would it be possible to display the counts of the bridges?
Thank you for chart 11/12, proportion of timber bridges by county. On the original post, i thought immediately of south central Oregon of a week i spent visiting all the wooden covered bridges.
Comments are closed.