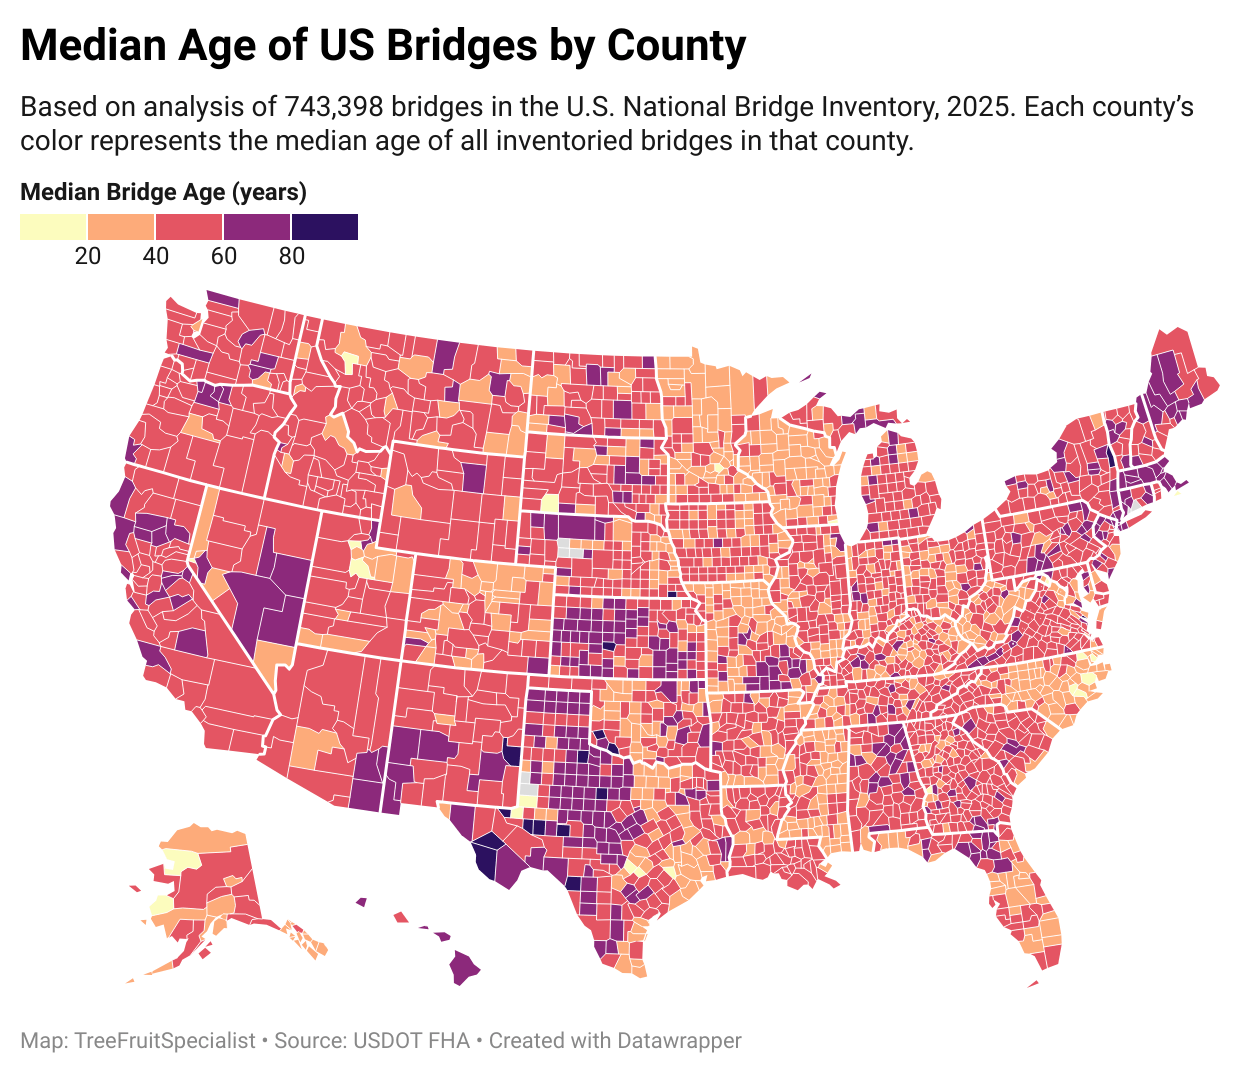
[OC] This map shows the median bridge age by county in the United States, based on the 2025 National Bridge Inventory, which includes 743,398 bridges. Only structures longer than 20 feet that meet federal criteria are included. Additional information for what qualifies in this dataset can be found in previous posts:
Each county’s value represents the median construction year of its qualifying bridges. Gray counties indicate either missing data or no qualifying bridges.
The interactive map has tooltips that have the number of bridges, median age, year of first bridge and newest bridge by county. [Interactive map](https://www.datawrapper.de/_/8qRq7/)
I processed the data in R and visualized the results in Datawrapper.
I’d be interested in seeing the average expected lifespan remaining on bridges, overall age is one thing but lifetime before replacing is important.
You need to remove all of the “under” records in the dataset (Item 5a <> 1) to get the correct overall inventory. You should end up with something like 620k-625k bridges if using the 2025 data set.
Under records are partial sub-records of routes going under an overpassing bridge. Their primary purpose is to record clearance information and may or may not contain year built information. If it does, it would duplicate the data from the “over” record so it’s best to remove them to get accurate inventory data.
You can use FHWA’s InfoBridge site (https://infobridge.fhwa.dot.gov/Data) to check your findings though it looks like it hasn’t yet been updated with the 2025 data yet.
Which of those is Madison county? You could do a whole other post on its bridges.
Man, I read “brides”, and let me tell you, I was astonished!
Unless I’m reading this incorrectly, it looks like Mississippi, Minnesota, and North Carolina are the only ones replacing their bridges recently (or building a ton of new ones). Minnesota makes sense, given the major bridge collapse 20 years ago just outside Downtown Minneapolis.
![How Old Are Your County’s Bridges? Median Age of U.S. Bridges Mapped [OC]](https://www.europesays.com/wp-content/uploads/2025/07/tcdswdoai9ff1-1240x1024.png)
10 comments
[OC] This map shows the median bridge age by county in the United States, based on the 2025 National Bridge Inventory, which includes 743,398 bridges. Only structures longer than 20 feet that meet federal criteria are included. Additional information for what qualifies in this dataset can be found in previous posts:
[Concrete vs. Steel pt. 2](https://www.reddit.com/r/dataisbeautiful/comments/1m9yz8w/comment/n5aqx96/?utm_source=share&utm_medium=web3x&utm_name=web3xcss&utm_term=1&utm_content=share_button)
[Concrete vs. Steel pt. 1](https://www.reddit.com/r/dataisbeautiful/comments/1m9adn7/steel_vs_concrete_what_are_americas_bridges/?utm_source=share&utm_medium=web3x&utm_name=web3xcss&utm_term=1&utm_content=share_button)
Each county’s value represents the median construction year of its qualifying bridges. Gray counties indicate either missing data or no qualifying bridges.
The interactive map has tooltips that have the number of bridges, median age, year of first bridge and newest bridge by county. [Interactive map](https://www.datawrapper.de/_/8qRq7/)
I processed the data in R and visualized the results in Datawrapper.
I’d be interested in seeing the average expected lifespan remaining on bridges, overall age is one thing but lifetime before replacing is important.
You need to remove all of the “under” records in the dataset (Item 5a <> 1) to get the correct overall inventory. You should end up with something like 620k-625k bridges if using the 2025 data set.
Under records are partial sub-records of routes going under an overpassing bridge. Their primary purpose is to record clearance information and may or may not contain year built information. If it does, it would duplicate the data from the “over” record so it’s best to remove them to get accurate inventory data.
You can use FHWA’s InfoBridge site (https://infobridge.fhwa.dot.gov/Data) to check your findings though it looks like it hasn’t yet been updated with the 2025 data yet.
Which of those is Madison county? You could do a whole other post on its bridges.
Man, I read “brides”, and let me tell you, I was astonished!
Unless I’m reading this incorrectly, it looks like Mississippi, Minnesota, and North Carolina are the only ones replacing their bridges recently (or building a ton of new ones). Minnesota makes sense, given the major bridge collapse 20 years ago just outside Downtown Minneapolis.
https://preview.redd.it/rmsrcdk36aff1.png?width=1126&format=png&auto=webp&s=8805e11f9beb4dc5f90c6f1d479cf8175bc0fb50
Bridges of historical significance are preserved. Rivers are the main reason bridges exist.
Texas infrastructure just sucks in general – crap electric grid, crap severe weather warning systems, crap bridges.
Bridges feel so ancient and crumbling here in pittsburgh- I’m surprised Allegheny county is not purple. Or any of SW PA
They last longer in colder, drier climates and/or where traffic is lower.
Comments are closed.