
As European markets experience tentative optimism amid potential trade agreements with the U.S., the pan-European STOXX Europe 600 Index has seen a modest rise. In this environment, identifying stocks that may be trading below their estimated value can offer investors opportunities to potentially capitalize on market inefficiencies and favorable economic conditions.
Top 10 Undervalued Stocks Based On Cash Flows In EuropeNameCurrent PriceFair Value (Est)Discount (Est)Talenom Oyj (HLSE:TNOM)€3.52€6.9449.3%StrongPoint (OB:STRO)NOK11.20NOK22.3950%Selvita (WSE:SLV)PLN34.90PLN69.7950%Laboratorios Farmaceuticos Rovi (BME:ROVI)€55.20€109.1249.4%JOST Werke (XTRA:JST)€51.90€102.8149.5%Green Oleo (BIT:GRN)€0.79€1.5850%Expert.ai (BIT:EXAI)€1.516€3.0149.6%ATON Green Storage (BIT:ATON)€2.13€4.2249.5%Atea (OB:ATEA)NOK142.40NOK282.9049.7%Aquila Part Prod Com (BVB:AQ)RON1.44RON2.8850%
Let’s explore several standout options from the results in the screener.
Overview: Exosens develops, manufactures, and sells electro-optical technologies focusing on amplification, detection, and imaging across various regions globally with a market capitalization of €2.04 billion.
Operations: The company’s revenue is derived from two main segments: €280.20 million from amplification and €117.50 million from detection and imaging.
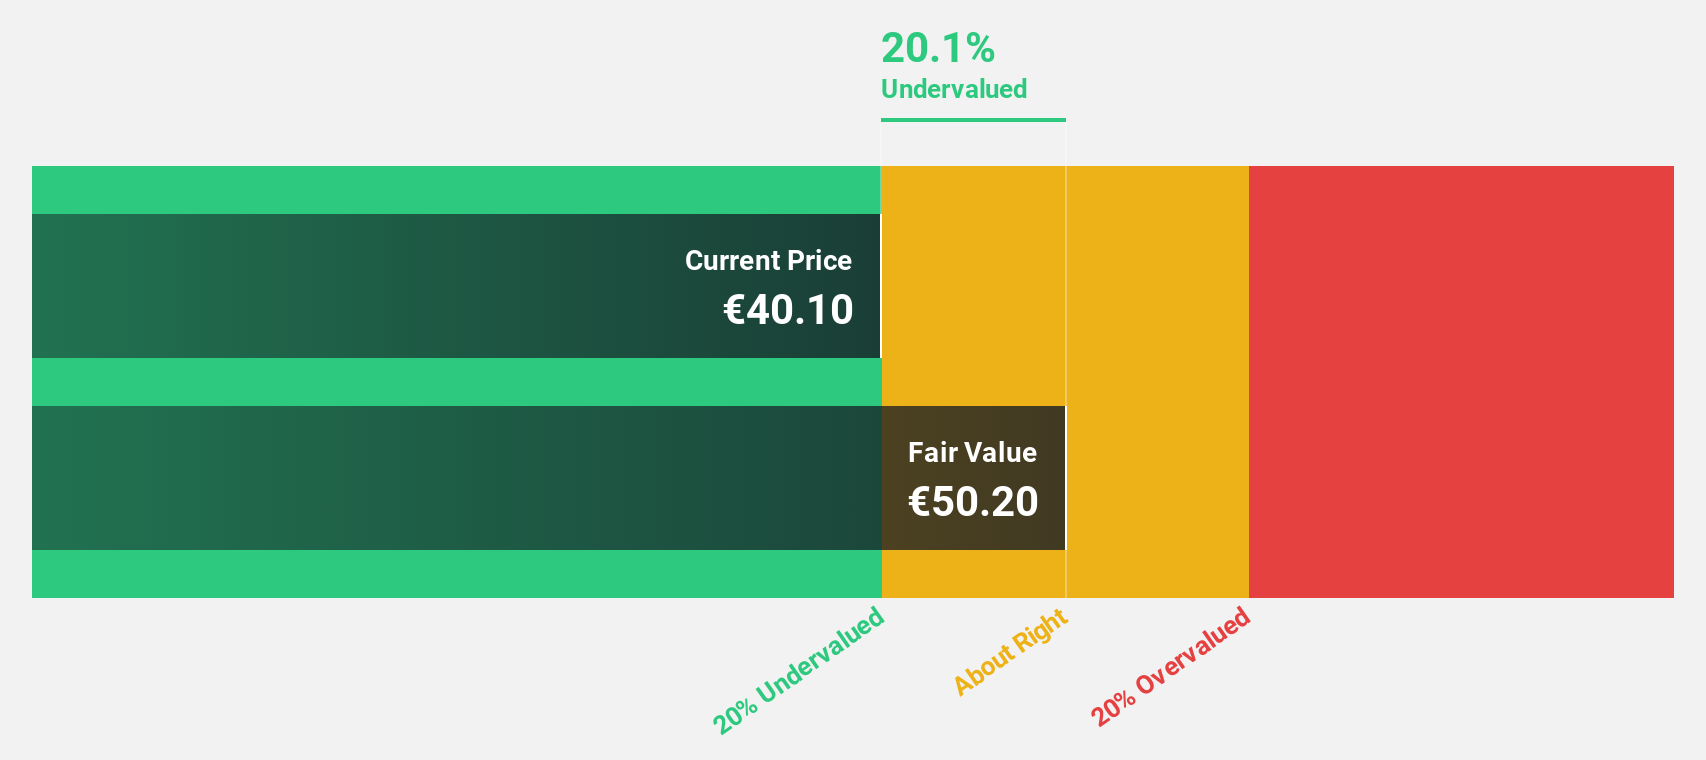
Estimated Discount To Fair Value: 20.1%
Exosens is trading at €40.1, below its estimated fair value of €50.2, indicating it’s undervalued by over 20%. Recent earnings showed strong growth with net income rising to €27.9 million from €2.9 million year-over-year, and sales increasing to €224.5 million from €186.9 million. Earnings are forecasted to grow significantly at 26% annually, outpacing the French market’s 13%, despite a slower revenue growth rate of 11% per year.
Overview: Lisi S.A. designs and produces assembly and component solutions for the aerospace, automotive, and medical sectors in France and internationally, with a market cap of €2.19 billion.
Operations: The company’s revenue is derived from three main segments: €1.13 billion from LISI Aerospace, €561.21 million from LISI Automotive, and €183.94 million from LISI Medical.
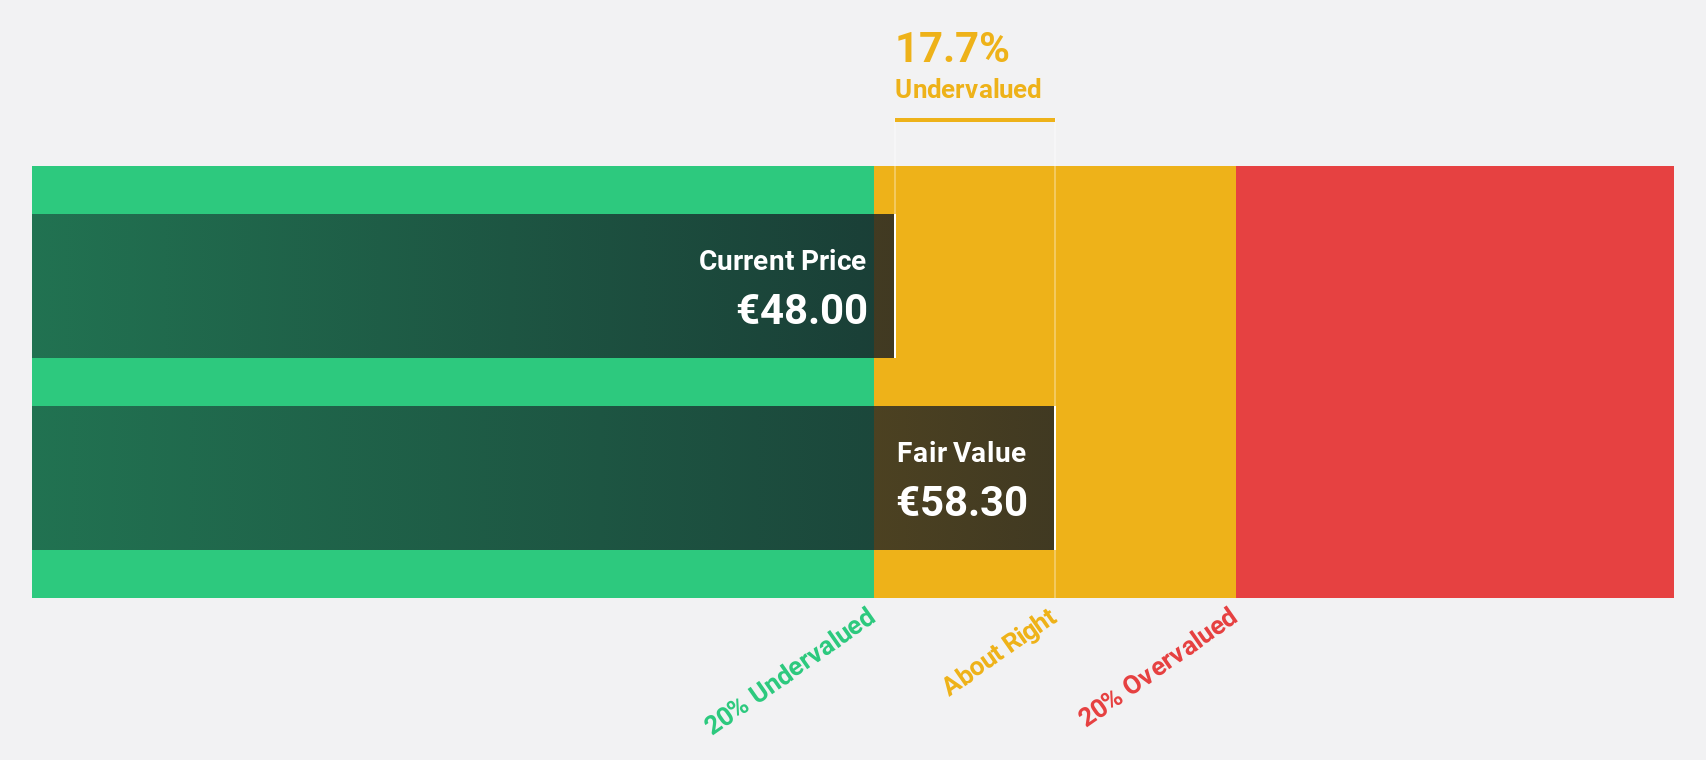
Estimated Discount To Fair Value: 17.7%
Lisi is trading at €48, below its estimated fair value of €58.3, reflecting an undervaluation of 17.7%. The company’s earnings are projected to grow significantly by 31.2% annually over the next three years, surpassing the French market’s average growth rate of 13%. Recent half-year results show revenue increased to €1.03 billion from €961.46 million year-over-year, with net income rising to €38.51 million from €31.57 million, although high debt levels remain a concern.
Overview: Cicor Technologies Ltd., along with its subsidiaries, develops and manufactures electronic components, devices, and systems on a global scale with a market cap of CHF844.83 million.
Operations: The company’s revenue is primarily derived from its Advanced Substrates Division, contributing CHF40.70 million, and its Electronic Manufacturing Services Division, which accounts for CHF492.60 million.
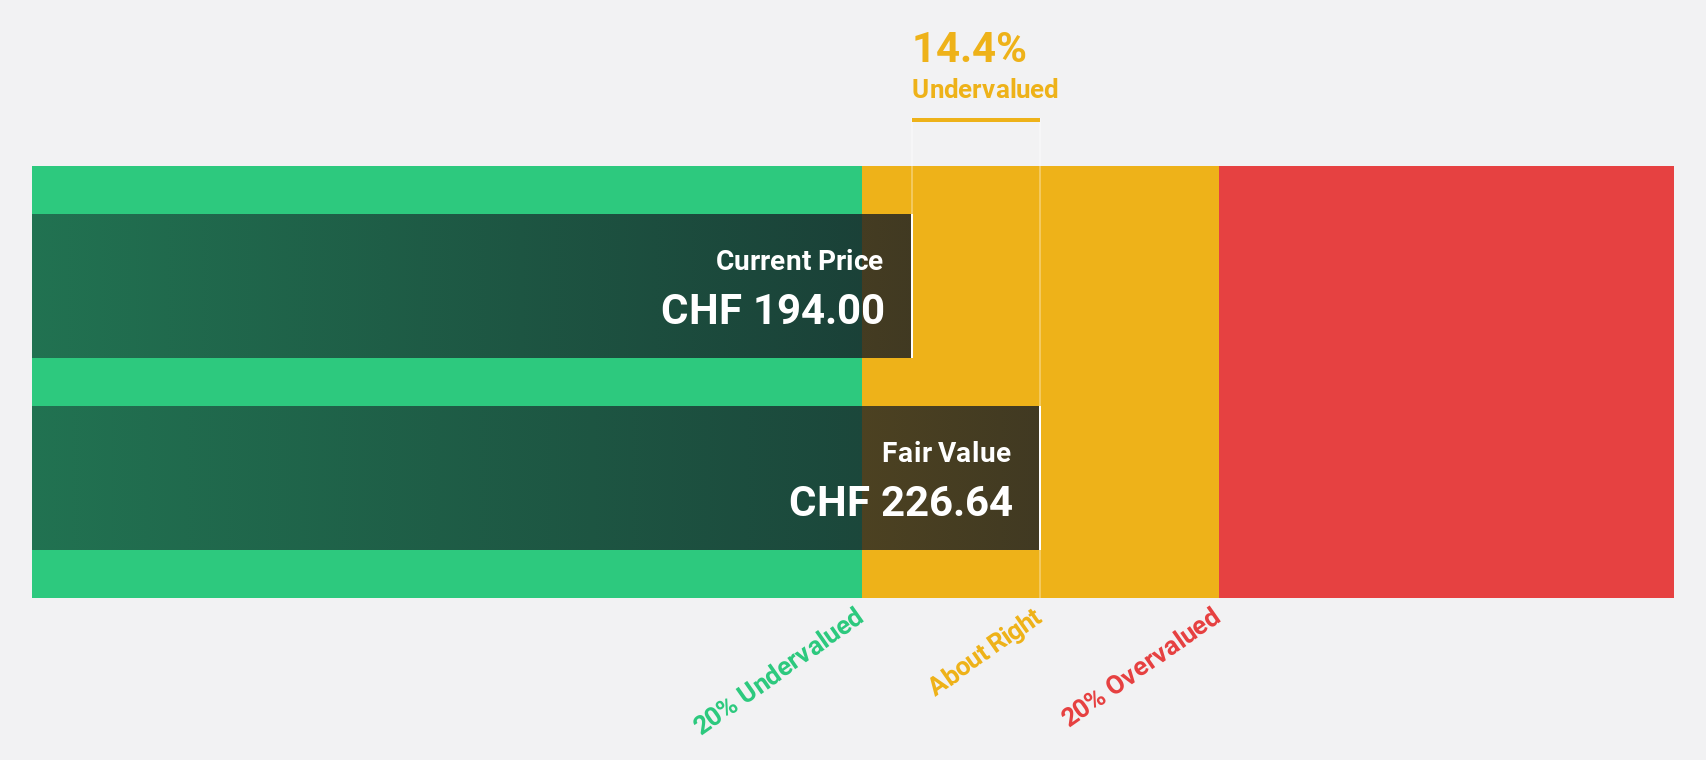
Estimated Discount To Fair Value: 14.4%
Cicor Technologies is trading at CHF194, below its estimated fair value of CHF226.64, indicating a 14.4% undervaluation. Despite high debt and recent shareholder dilution, earnings are forecast to grow significantly by 37.7% annually over the next three years, outpacing the Swiss market’s growth rate of 11.3%. Recent acquisitions in Europe enhance Cicor’s position in aerospace and defense sectors, though H1 net income declined to CHF8.48 million from CHF11.89 million year-over-year.
This article by Simply Wall St is general in nature. We provide commentary based on historical data
and analyst forecasts only using an unbiased methodology and our articles are not intended to be financial advice.
It does not constitute a recommendation to buy or sell any stock, and does not take account of your objectives, or your
financial situation. We aim to bring you long-term focused analysis driven by fundamental data.
Note that our analysis may not factor in the latest price-sensitive company announcements or qualitative material.
Simply Wall St has no position in any stocks mentioned.
Our new AI Stock Screener scans the market every day to uncover opportunities.
• Dividend Powerhouses (3%+ Yield)
• Undervalued Small Caps with Insider Buying
• High growth Tech and AI Companies
Or build your own from over 50 metrics.
Have feedback on this article? Concerned about the content? Get in touch with us directly. Alternatively, email editorial-team@simplywallst.com