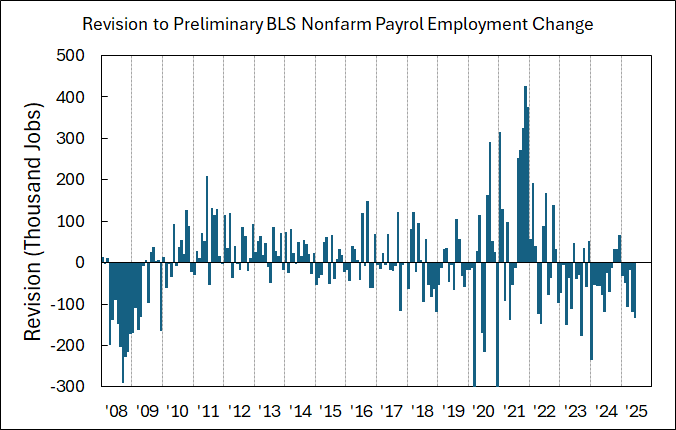
Created in Excel. Y-axis range excludes two negative spikes (due to COVID).
The absolute size of the revision is important, but the size relative to the original number is importanter.
My take-away: the preliminary reports are not good at capturing extremes, so the revisions can tell a story of where the economy is. When times are good, BLS (Bureau of Labor Statistics) generally revises up (e.g., see 2011-2016). When times are challenging, BLS revises down (see 2008). We’ve been revising down effectively since the end of the chaotic portion of the pandemic (’22~’23).
6 comments
Sources:
* Revised BLS numbers: https://data.bls.gov/pdq/SurveyOutputServlet
* Preliminary BLS numbers from individual report archive: https://www.bls.gov/bls/news-release/empsit.htm
Created in Excel. Y-axis range excludes two negative spikes (due to COVID).
The absolute size of the revision is important, but the size relative to the original number is importanter.
My take-away: the preliminary reports are not good at capturing extremes, so the revisions can tell a story of where the economy is. When times are good, BLS (Bureau of Labor Statistics) generally revises up (e.g., see 2011-2016). When times are challenging, BLS revises down (see 2008). We’ve been revising down effectively since the end of the chaotic portion of the pandemic (’22~’23).
Sorry for the typo in the chart title 🙁
Their survey response rates have [decreased](https://www.bls.gov/osmr/response-rates/) considerably over the past 10 years.
Small detail: if you’re going to say BLS, you should define it at least once. Not everyone knows every government organization for every country.
’08 and 2020 makes sense, 2021 nakes sense, 2023 and 2024 don’t make as much sense, and 2025 seems similarly overreported as 2023-2024
Comments are closed.