![[OC] I Turned Every Goal Scored In The NHL From 2023+ Into A Star Chart](https://www.europesays.com/wp-content/uploads/2025/08/iipxl5lfjogf1-1920x1024.png)
This has been a fun project for me in the offseason. The main inspiration is the beautiful Map of Github
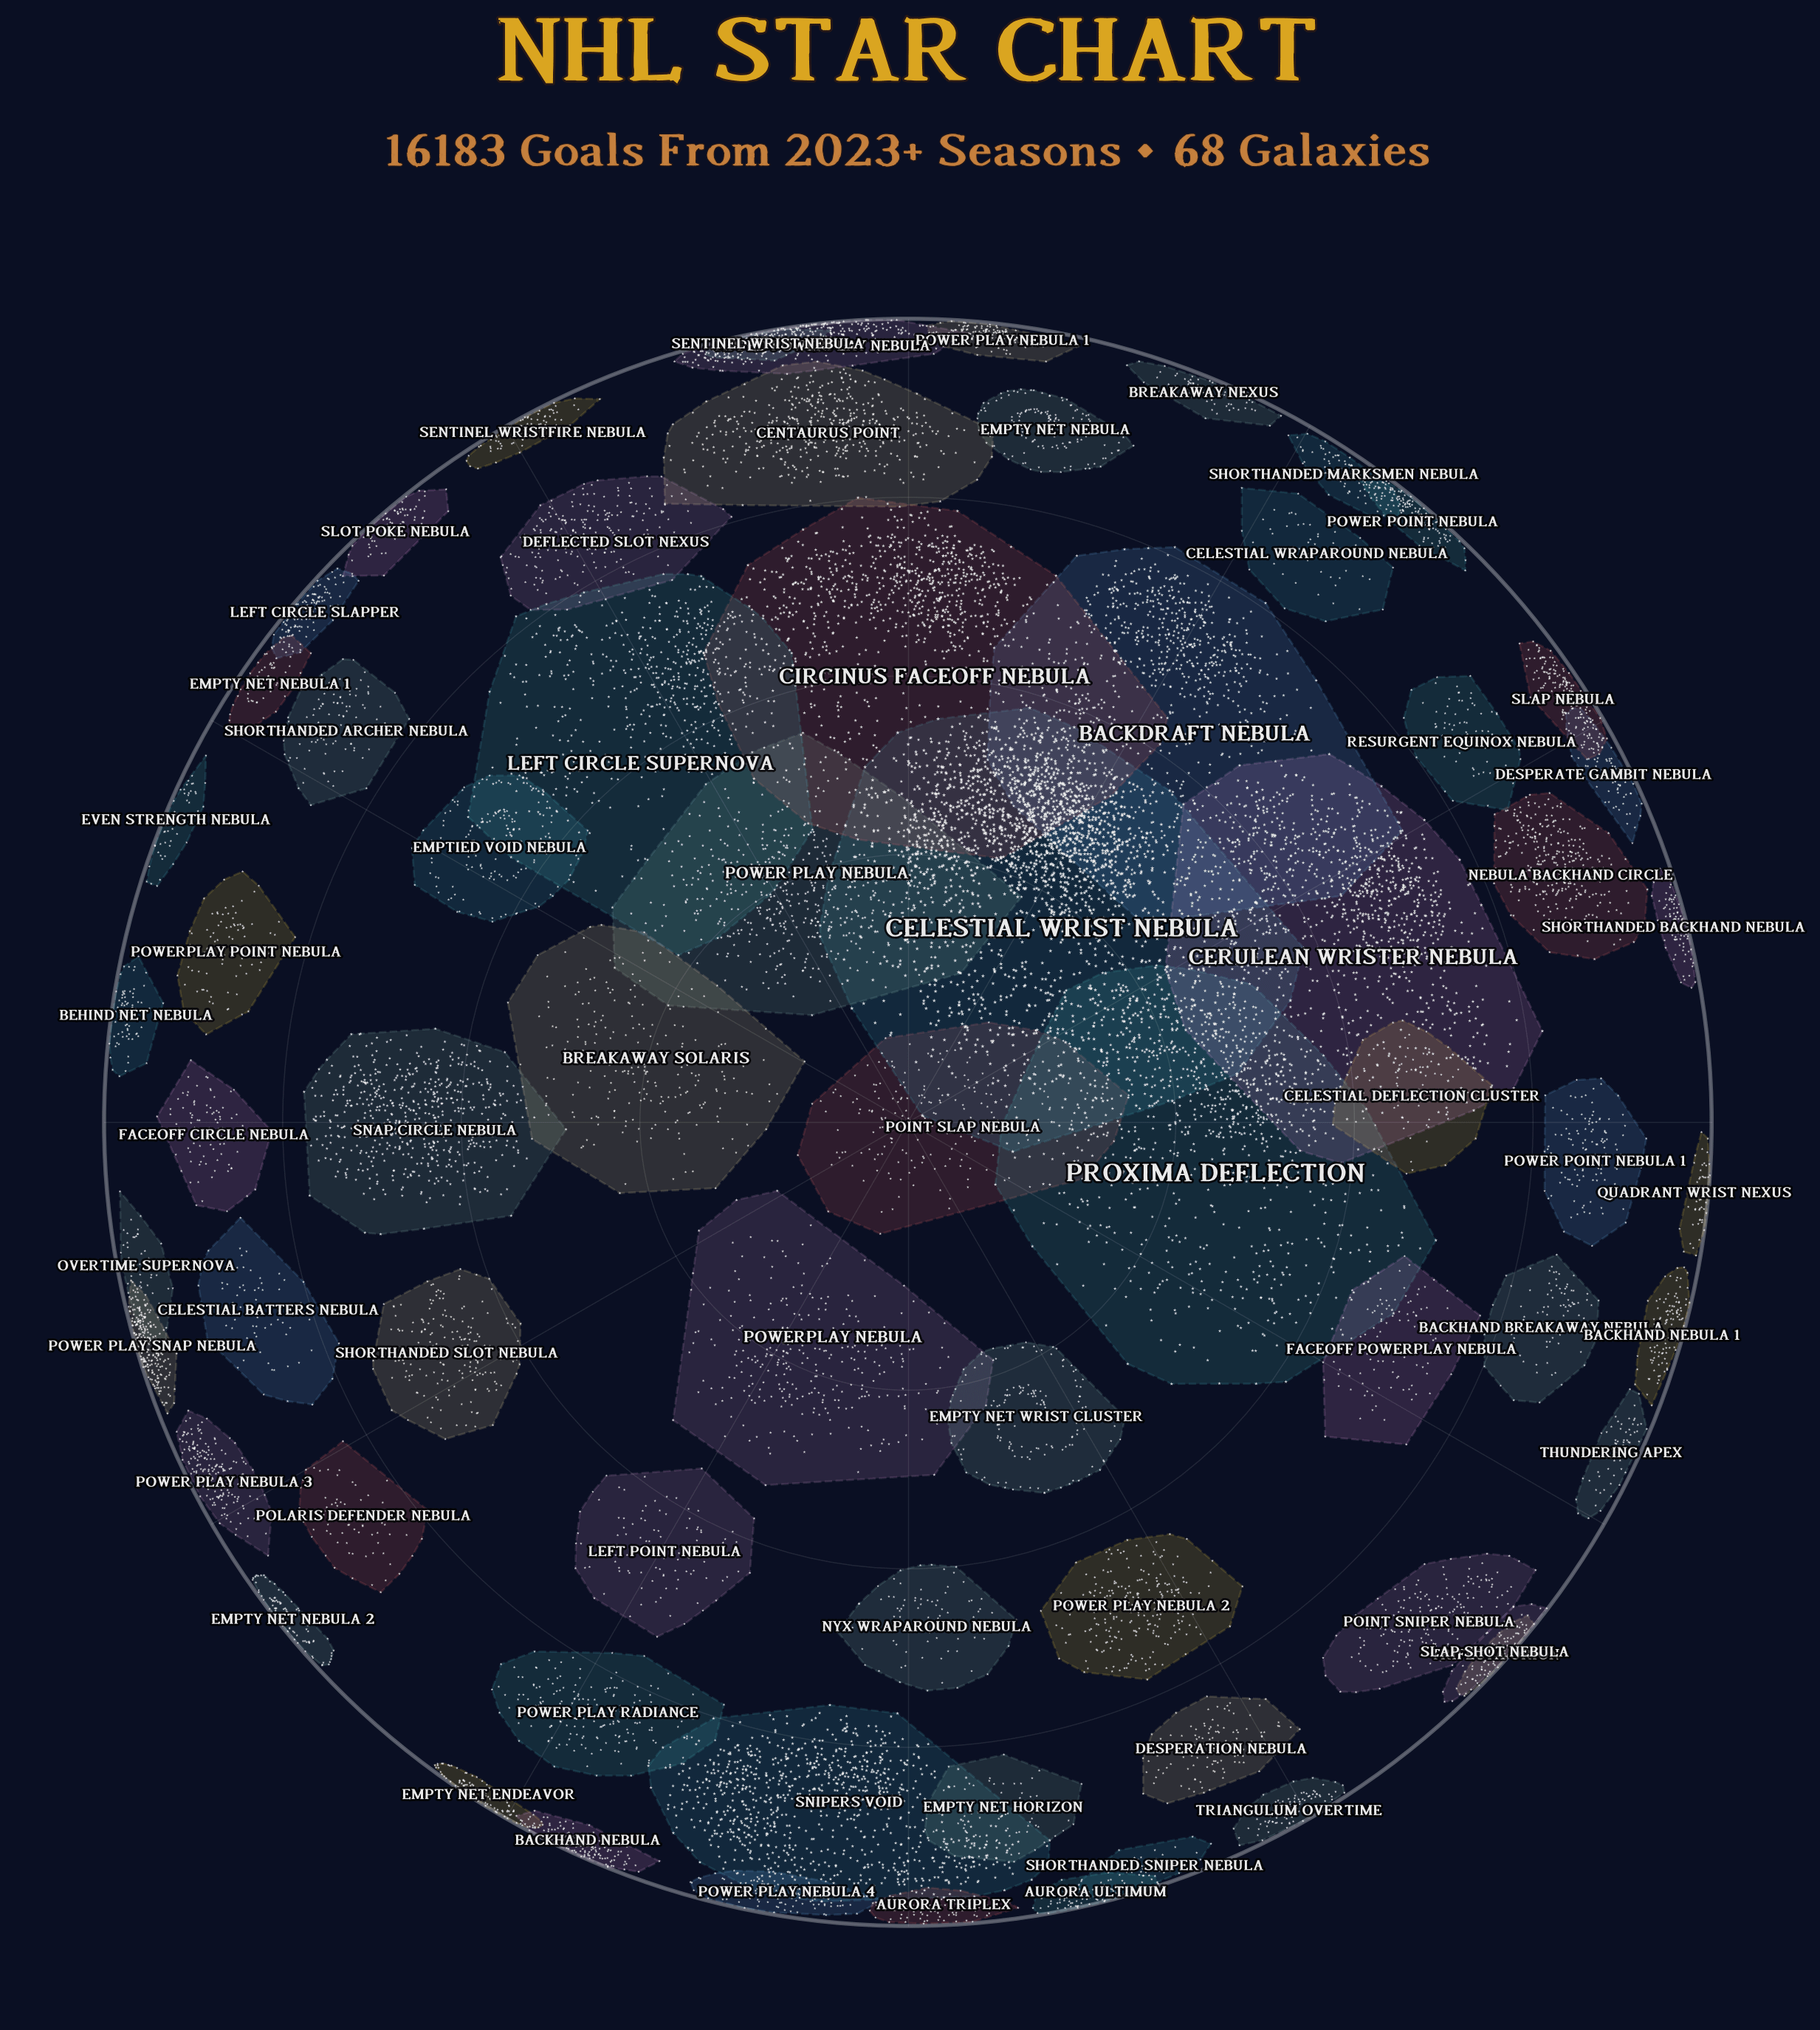
The main gist of the project is to take information about each goal scored in the NHL and then go through multiple levels of clustering to generate different celestial objects. You are only able to see the top level of clustering in the fake star chart.
- The top level, galaxies, are formed from shot type, shot location, and game state.
- The second group, clusters, are formed from period, time, and game score.
- The final layer, solar systems are formed from a name similarity of goal scorer and goaltender search between goals in that cluster.
There is an associated interactive visualization called nhl-cartography where you can create "constellations" for all goals scored by a player. It also links to the actual video highlights of those goals.
A full free roam mode is available here nhl-cartography-free-roam but be warned, it really only works well on desktop browsers. Overall, was a lot of fun and produced some cool visualizations. The Github project is here.
Data Source: NHL API
Posted by lograv27
4 comments
I have no idea what I’m looking at 🙃
What is the difference between Empty Net Nebula and Empty Net Endeavor?
This is one of the more innovative posts here in a long time, the video links are the cherry on top 👌
Why are there 6 different power play nebulas?
Comments are closed.