Data Source: GHSL
Tools: Python (For Data), JavaScript (For Map)
Mumbai is part of the sea
I’ll rather say that every area being less dense has a very good reason.
[Edited this part out]
That patch of less dense area in the northwestern side is because of the Thar Desert
The most dense area in general, the midwestern part, is called the Alluvial Belt.
> Alluvial soil is a type of fertile soil formed by the deposition of sediments, like silt, sand, and gravel, carried by rivers and other flowing water.
In this case, there are a lot of rivers passing through this region right from the Himalayas from the **northern part of India (right from Uttarakhand).**
Regarding the rest, I don’t have much idea, but I have already said whatever I know
Edit: [Edited this part out]
Edit 2: That no density patch on the northern side is mainly because of the fact that… difficult terrain. That’s it. You wouldn’t want to live there. One can compare the terrain and the weather to Tibet. Same thing for the northeastern part of India (in this map, it’s in the far east), because the Himalayas are nearby.
Edit 3: Regarding the northeast, one interesting thing I noticed is that it’s quite less dense in the Garo-Khasi-Jaintia Hills (please google the location). There locate two of the most rainy places in the world: Cherapunji and Mawsynram. A perfect example of Orographic Rainfall: the rainfall caused after the clouds hit the mountains.
Actual beautiful data?
I understand the bright spots are high dense spots. But what do the changes in background colour represent(black-purple)
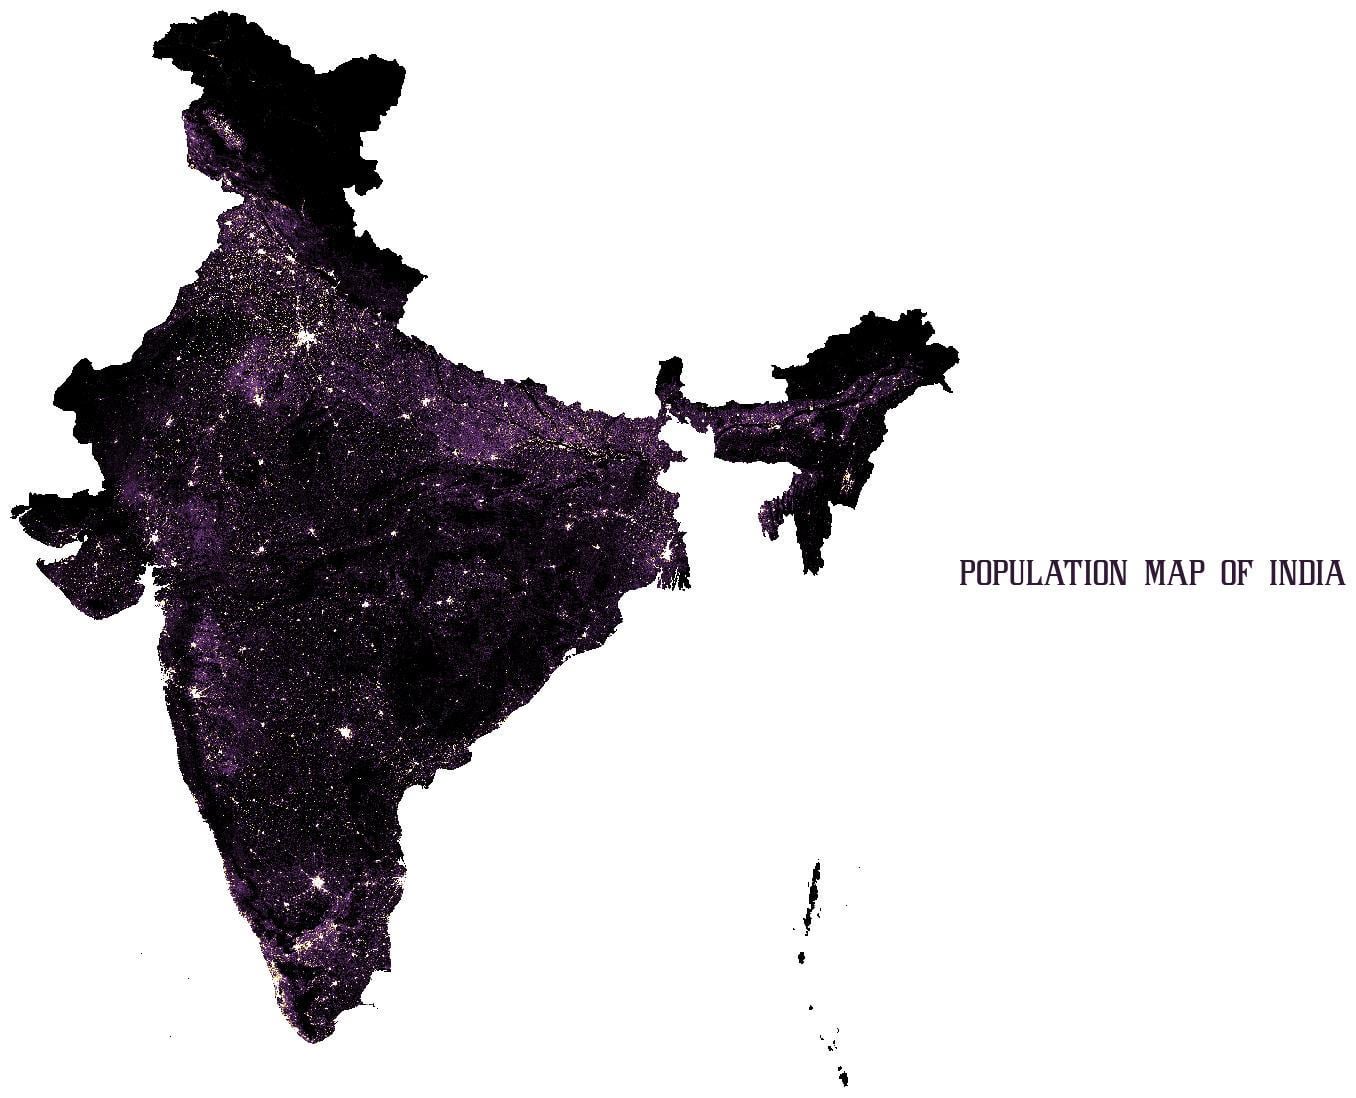
![[OC] Population Distribution Map of India](https://www.europesays.com/wp-content/uploads/2025/08/hwuug4demsgf1-1356x1024.jpeg)
5 comments
I’ve been there. Data don’t lie.
Data Source: GHSL
Tools: Python (For Data), JavaScript (For Map)
Mumbai is part of the sea
I’ll rather say that every area being less dense has a very good reason.
[Edited this part out]
That patch of less dense area in the northwestern side is because of the Thar Desert
The most dense area in general, the midwestern part, is called the Alluvial Belt.
> Alluvial soil is a type of fertile soil formed by the deposition of sediments, like silt, sand, and gravel, carried by rivers and other flowing water.
In this case, there are a lot of rivers passing through this region right from the Himalayas from the **northern part of India (right from Uttarakhand).**
Regarding the rest, I don’t have much idea, but I have already said whatever I know
Edit: [Edited this part out]
Edit 2: That no density patch on the northern side is mainly because of the fact that… difficult terrain. That’s it. You wouldn’t want to live there. One can compare the terrain and the weather to Tibet. Same thing for the northeastern part of India (in this map, it’s in the far east), because the Himalayas are nearby.
Edit 3: Regarding the northeast, one interesting thing I noticed is that it’s quite less dense in the Garo-Khasi-Jaintia Hills (please google the location). There locate two of the most rainy places in the world: Cherapunji and Mawsynram. A perfect example of Orographic Rainfall: the rainfall caused after the clouds hit the mountains.
Actual beautiful data?
I understand the bright spots are high dense spots. But what do the changes in background colour represent(black-purple)
Comments are closed.