Let’s see how long until BRKA hits $1 million per share
-59% profit decrease Y/Y? Damn
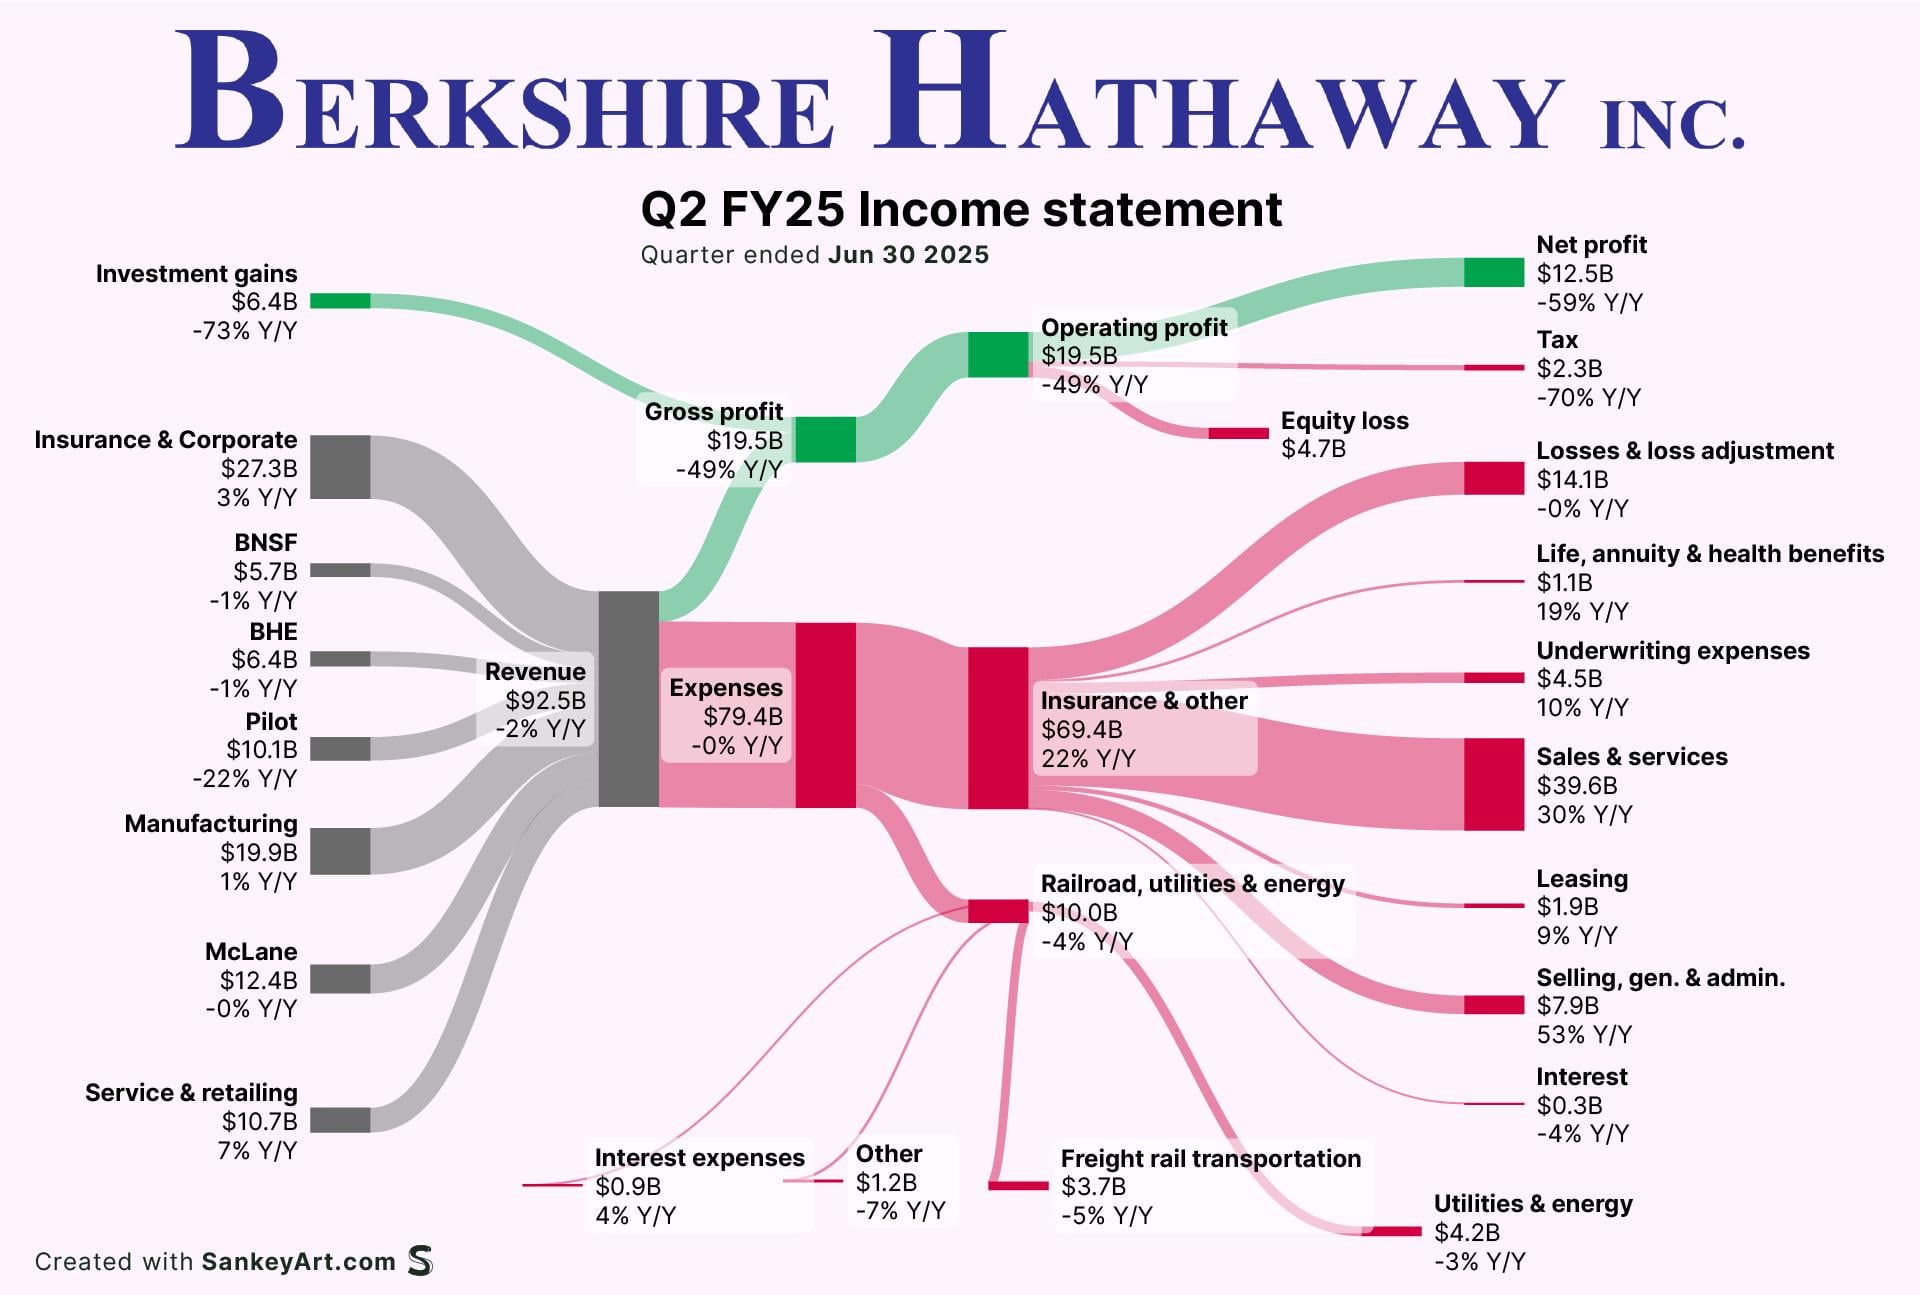
This feels like a case where a Sankey chart obscures and confuses things by aggregating costs and obfuscating where profits are coming from. The major companies on the revenue side have independent costs and profits/losses and that information gets aggregated away in the chart. I realize it’s mostly taken from the quarterly income statement, but I kinda feel like the tabular presentation is easier to follow.
Might be helpful to color code both revenues and costs by operating group (ie insurance and rail, utilities, energy) kind of how you have the investment gains separate. Also would be good to show the $11 billion in profit from the operating companies separate from the investment gains, since Buffett is very clear about how those should be viewed differently (despite having to co-mingle them in the accounting).
![[OC] Behind Berkshire Hathaway’s latest Billions](https://www.europesays.com/wp-content/uploads/2025/08/y5ahx2nij2hf1-1920x1024.jpeg)
4 comments
Source: Berkshire Hathaway investor relations
Tool: [SankeyArt](http://sankeyart.com) sankey chart generator
Diversified revenue, diversified expenses, steady profits
Nothing shocking besides Berkshire’s $344 billion cash pile.
Let’s see how long until BRKA hits $1 million per share
-59% profit decrease Y/Y? Damn
This feels like a case where a Sankey chart obscures and confuses things by aggregating costs and obfuscating where profits are coming from. The major companies on the revenue side have independent costs and profits/losses and that information gets aggregated away in the chart. I realize it’s mostly taken from the quarterly income statement, but I kinda feel like the tabular presentation is easier to follow.
Might be helpful to color code both revenues and costs by operating group (ie insurance and rail, utilities, energy) kind of how you have the investment gains separate. Also would be good to show the $11 billion in profit from the operating companies separate from the investment gains, since Buffett is very clear about how those should be viewed differently (despite having to co-mingle them in the accounting).
Comments are closed.