The data source is: United Nations, Department of Economic and Social Affairs, Population Division. World Population Prospects: The 2024 Revision. (Medium variant)
Another pointless animation.
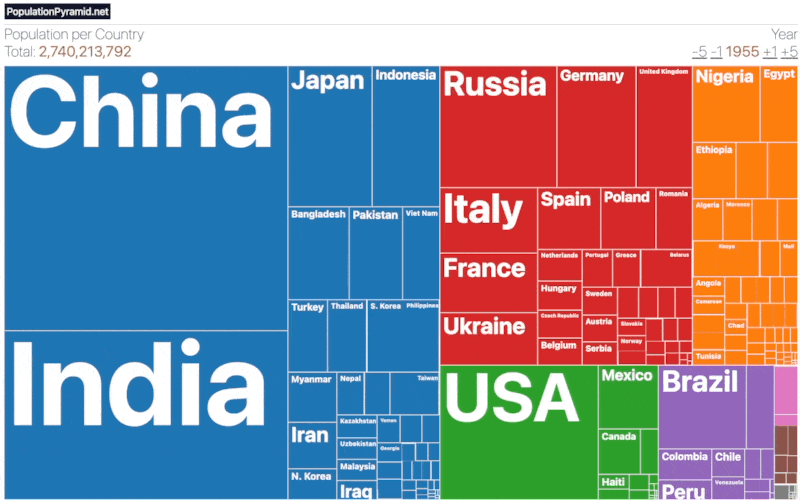
This is way too cluttered to get any information from. I can track India China USA and one or two others that pop up into top 5.
I personally don’t think it’s a ‘pointless animation’, it’s interesting to follow individual nations like I did with Nigeria
So the colors are continents got it
Its interesting to see how African population increases over time compared to others
Anything after 5 seconds is useless
I don’t think it’s as bas as people here suggest – the visualisation type makes sense for this data set, and there are some interesting trends to be observed here.
Two issues I can see here:
1. The extrapolation for the “past 2025 future” doesn’t take into consideration any economical / social / technological trends, so its value is limited. All you can get out of it is “if nothing changes, future population trends will be like that” but we know things will change.
2. Video recording is hard to follow, I’ve seen similar data visualisations with a slider, so the users can move through the timescale themselves. I appreciate you can do the same with the video player but it’s not as user friendly.
This is showing each country’s share of the population per year since the data is normalized to take up the same area despite world population growing. It would be cool to see a version of the animation where total area represents the peak world population and just add in a void area to fill up the unused space for all other years.
9 comments
I made this using d3.js. This is a capture of an interactive website which is visible here: [https://www.populationpyramid.net/population-size-per-country/2024/](https://www.populationpyramid.net/population-size-per-country/2024/)
The data source is: United Nations, Department of Economic and Social Affairs, Population Division. World Population Prospects: The 2024 Revision. (Medium variant)
Another pointless animation.
This is way too cluttered to get any information from. I can track India China USA and one or two others that pop up into top 5.
I personally don’t think it’s a ‘pointless animation’, it’s interesting to follow individual nations like I did with Nigeria
So the colors are continents got it
Its interesting to see how African population increases over time compared to others
Anything after 5 seconds is useless
I don’t think it’s as bas as people here suggest – the visualisation type makes sense for this data set, and there are some interesting trends to be observed here.
Two issues I can see here:
1. The extrapolation for the “past 2025 future” doesn’t take into consideration any economical / social / technological trends, so its value is limited. All you can get out of it is “if nothing changes, future population trends will be like that” but we know things will change.
2. Video recording is hard to follow, I’ve seen similar data visualisations with a slider, so the users can move through the timescale themselves. I appreciate you can do the same with the video player but it’s not as user friendly.
This is showing each country’s share of the population per year since the data is normalized to take up the same area despite world population growing. It would be cool to see a version of the animation where total area represents the peak world population and just add in a void area to fill up the unused space for all other years.
Comments are closed.