This research calculates the LQ of innovation output across the administrative regions in the AI industry. The results show that there are thirty-three cities whose LQ is greater than 1.Footnote 17 Four regions (Fuxin, Jilin, Sanya, and Shanwei) that do not meet the threshold of the innovation scale are excluded.Footnote 18 The twenty-nine retained regions (Beijing, Shenzhen, Nanjing, Hangzhou, Xi’an, Shanghai, Wuhan, Harbin, Zhuhai, Guangzhou, Guilin, Jinan, Chengdu, Hefei, Changsha, Nanchang, Qinhuangdao, Shenyang, Changchun, Fuzhou, Xiamen, Mianyang, Kunming, Dalian, Dongguan, Chongqing, Tianjin, Taiyuan, and Zhengzhou) are regarded as potential AI clusters. The potential AI clusters are illustrated in Fig. 2.

The figure is drawn using Microsoft Excel.
To investigate the local and external innovation connections of potential AI clusters, we calculate the total volume of intraregional and interregional collaborations for these clusters, respectively. The outcomes are depicted in Table 1. The high total volume of intraregional collaborations in clusters such as Beijing, Shenzhen, Nanjing, Guangzhou, Shanghai, Hangzhou, Zhuhai, Wuhan, Chengdu, Tianjin, Jinan, and others indicates their focus on internal innovation activities. The high total volume of interregional collaborations among clusters such as Beijing, Nanjing, Shenzhen, Hangzhou, Shanghai, Guangzhou, Wuhan, Chengdu, Jinan, Tianjin, Nanchang, Hefei, and others indicates their emphasis on external resource acquisition. In conclusion, all twenty-nine potential AI clusters have both intraregional and interregional innovation collaborations, satisfying the criteria for cluster identification.
Because the total volume of interregional collaborations exceeds that of intraregional collaborations in each AI cluster, we can conclude that interregional cooperation is the main form of collaboration for AI clusters. Further, the innovation network of interregional cooperation is constructed in this research. To be specific, we match each region involved in interregional cooperation patents with other regions.Footnote 19 Connections containing the AI clusters are regarded as network edges. Using the total collaboration volume as the weight of network nodes and the number of collaborations as the weight of network edges, we depict the innovation network for the AI clusters in Fig. 3. We find that the innovation network containing the AI clusters is highly dense. Beijing occupies an absolutely central position. The roles of Nanjing, Hangzhou, and Shanghai as significant cities in Eastern China are prominently highlighted. Shenzhen and Guangzhou, two major cities in Southern China, serve as pivotal hubs. Wuhan and Chengdu, representing Central and Western China, respectively, actively engage in innovation collaborations with other areas.

The figure is generated in VOSviewer software.
Descriptive statistics
This study performs descriptive statistics for all the variables. The outcomes are displayed in Table 2. The mean values of TI, IP, and NC are 5.898, 2.006, and 2.682, respectively. Moreover, the standard deviations of TI and IP are relatively high, which elucidates that gaps in both TI and IP exist across different AI clusters.
Correlation analysis
We observe a positive correlation between IP and TI from Table 3, which indicates that IP may enhance TI in the AI clusters. The correlation coefficients between each variable are less than 0.800. In addition, this research conducts a variance inflation factor (VIF) test. The maximum VIF of 3.410 is lower than 10, illustrating that there is no severe concern about multicollinearity in this study (e.g., Chen et al., 2024).
Regression analysis
The results of regression analysis of IP and TI are reported in Table 4. All p-values of AR(1) are less than 0.1, while those of AR(2) are greater than 0.1, indicating the presence of first-order autocorrelation but the absence of second-order autocorrelation in the random disturbance term. We thus accept the null hypothesis of “no autocorrelation in the random disturbance term”. Furthermore, the p-values of the Sargan test are all greater than 0.1, which illustrates that the problem of overidentification of instrumental variables does not exist, thereby allowing for estimation using System-GMM.
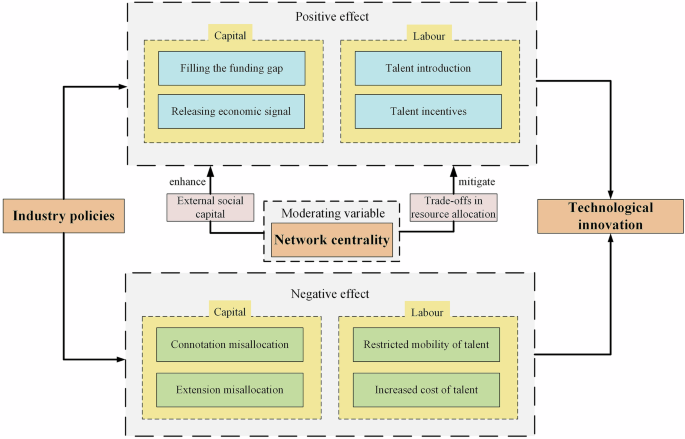
Model l contains only the control variables. The results displayed in Model 2 indicate that the coefficient of IP on TI is 0.037 and significant. IP can promote TI in the AI clusters. That is, the positive effects of IP on TI dominate over the negative ones. Moving on to Model 3, the interaction between IP and NC (i.e., IP*NC) is significantly negative, which illustrates that the high NC of clusters diminishes the positive impact of IP on TI in the AI clusters. Further, this paper visualizes the moderating effect of NC on the IP–TI connection. As shown in Fig. 4, IP responds to less TI with a high value of NC.
The figure is produced using Microsoft Excel.
Robustness checksSensitivity analysis
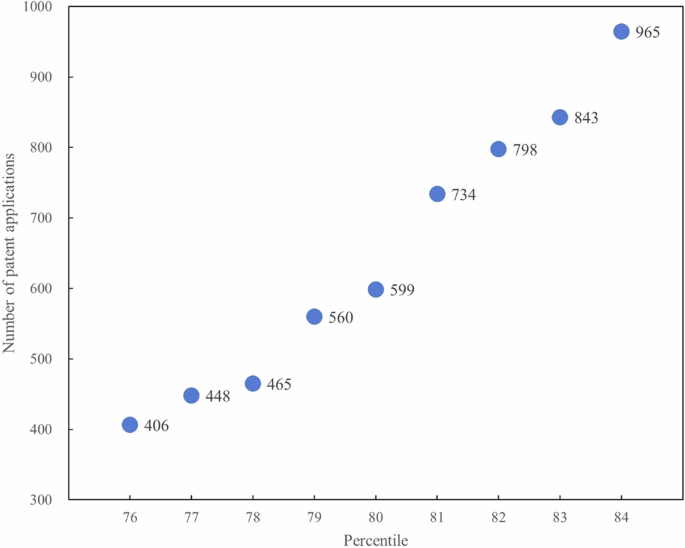
Quartiles are a scientifically and widely used classification method. In this section, we use the third quartile (i.e., the 75th percentile) instead of the 80th percentile for reidentifying potential clusters. The 75th percentile of patent applications for all regions is 386. The four regions (Fuxin, Jilin, Sanya, and Shanwei) are still excluded (see Supplementary Table B), which is consistent with the conclusion in Section “Cluster identification”. In addition, to avoid overlapping with the 75th percentile, we allow a fluctuation of ±4 percentage points around the 80th percentile and conduct multiple tests between the 76th and 84th percentiles. The results are shown in Fig. 5. The threshold for patent applications falls between 374 and 969 when a certain degree of error exists, and the aforementioned four regions remain excluded. Therefore, the conclusion of the twenty-nine AI clusters identified in this paper is robust.
The figure is produced using Microsoft Excel.
Placebo test
Conducting a placebo test serves to rule out the possibility that random factors unrelated to IP account for the observed effects, thereby guaranteeing a more reliable estimation. Drawing on the study of Zeng et al. (2024), we randomly shuffle IP across all clusters and then estimate the impact of randomly assigned IP on TI using System-GMM regression. This procedure is repeated 1000 times. If the correlation between IP and TI still exists, the previous conclusions are due to randomness rather than IP. The kernel density of the estimated coefficients plotted in Fig. 6 indicates that the coefficient of IP is 0.002, which is far from the real IP coefficient of 0.037. Therefore, the improvement of TI is driven by IP, not by random factors.
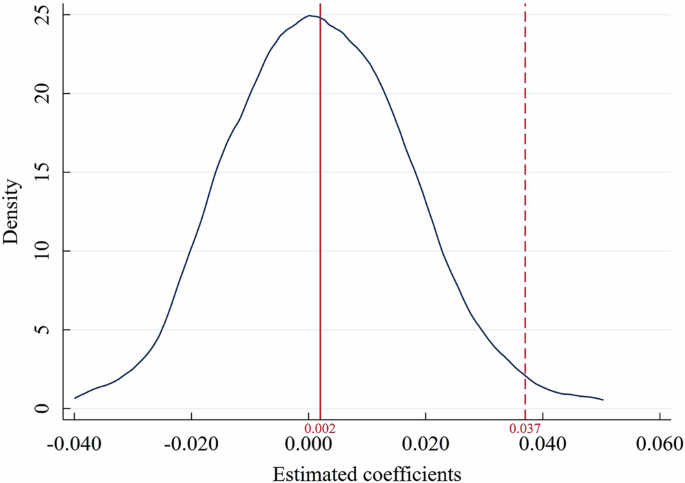
The red solid line represents the random IP coefficient, whereas the red dotted line denotes the real IP coefficient. The figure is produced using Stata software.
Policy penetration
Measuring IP by the number of incentive policies may not reflect implementation rigor. Enterprises act as the principal agents of innovation (Lei and Xie, 2023). To assess the impact of IP more accurately, we examine whether IP effectively reaches enterprises in practice. To be specific, the penetration process for IP is achieved in the following sequence: the release of IP documents, the government support (GS) obtained by enterprises, and the generation of TI. Drawing on the study of Xu et al. (2023), this article constructs the following mediation effect model:
$${{\rm{TI}}^{\wedge}}_{\rm{jt}}={\varphi }_{1}+{\lambda }_{1}{{{\rm{TI}}}^{\wedge}}_{{\rm{jt}-1}}+{{\rm{cIP}}}_{{\rm{jt}}}+{\gamma }_{11}{{\rm{Control}}}_{{\rm{jt}}}+{\eta }_{{\rm{j}}}+{\varepsilon }_{{\rm{jt}}}$$
(4)
$${\rm{G}}{S}_{{\rm{jt}}}={\varphi }_{2}+{\lambda }_{2}{\rm{G}}{S}_{{\rm{jt}}-1}+{{\rm{aIP}}}_{{\rm{jt}}}+{\gamma }_{21}{{\rm{Control}}}_{{\rm{jt}}}+{\eta }_{{\rm{j}}}+{\varepsilon }_{{\rm{jt}}}$$
(5)
$${{\rm{TI}}^{\wedge}}_{\rm{jt}}={\varphi }_{3}+{\lambda }_{3}{{{\rm{TI}}}^{\wedge}}_{{\rm{jt}-1}}+{{\rm{c}}^{\prime} {\rm{IP}}}_{{\rm{jt}}}+{\rm{bG}}{S}_{{\rm{jt}}}+{\gamma }_{31}{{\rm{Control}}}_{{\rm{jt}}}+{\eta }_{{\rm{j}}}+{\varepsilon }_{{\rm{jt}}}$$
(6)
where \({{{\rm{TI}}}^{\wedge}}_{\rm{jt}}\) represents the number of invention patent applications of enterprise \({\rm{j}}\) in year \({\rm{t}}\). \({{\rm{IP}}}_{{\rm{jt}}}\) is the number of incentive policies in the cluster where enterprise \({\rm{j}}\) is located. \({{\rm{GS}}}_{{\rm{jt}}}\) is measured by the government subsidies of enterprise \({\rm{j}}\) (e.g., Chen and Wang, 2022b). \({\text{Control}}_{\text{jt}}\) represents control variables, including enterprise profitability (EP), capital structure (CS), and operating capacity (OC). EP is calculated by the return on total assets (e.g., Chen and Wang, 2022a). The asset‒liability ratio stands for CS (e.g., Peng and Tao, 2022). OC is represented by the asset turnover ratio (e.g., Xu and Chen, 2020). The other symbols serve the same purpose as Eq. (3).
The mediation mechanism is plotted in Fig. 7. If the coefficients c, a, and b are all significant, GS has a mediating effect (Zhong and Zhang, 2024).

The figure is created using Microsoft Visio.
We acquire an AI enterprise list from the China Stock Market and Accounting Research (CSMAR) database.Footnote 20 Based on geographical location, we select 125 firms within clusters as our research samples.Footnote 21 The enterprise data come from the CSMAR database. System-GMM estimation is applied to investigate the mediating impact of GS. As displayed in Table 5, all p-values for AR(1) are less than 0.1, while those for AR(2) and the Sargan test exceed 0.1; thus, the adoption of System-GMM is appropriate. The results show that the coefficients for IP → TI^, IP → GS, and GS → TI^ are all significantly positive at the 1% level. Hence, IP promotes TI^ by strengthening GS. The conclusion verifies the penetration effect of IP.
Changing the regression model
Poisson regression is usually used for models where the dependent variable is count data. In this study, the dependent variable is “excessively dispersed”, i.e., the mean is less than the variance.Footnote 22 We thereby adopt negative binomial regression. The results displayed in Table 6 indicate that the coefficient of IP is significantly positive and that the coefficient of interaction between IP and NC is significantly negative. Therefore, the empirical outcomes of this research are reliable.