Analysis by Keith Rankin.
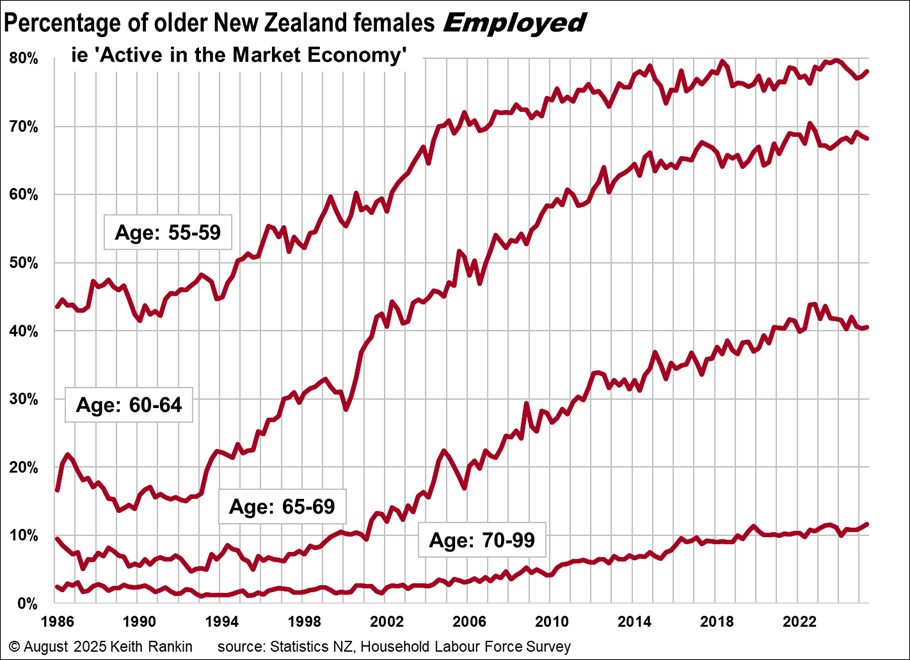 Chart by Keith Rankin.
Quarterly Labour market data in Aotearoa New Zealand was released today. Much of the data is functionally useless, because of definitions which disguise rather than reveal important trends and turning points.
I have focussed on employment data (although the definition of ’employment’ is too generous to be optimally useful) relative to estimated populations for age groups at the younger and older margins of the ‘working age’. (For me, ‘active in the market economy’ means meeting the official definition of employment. Unlike the International Labour Organisation, I am not classing unemployed people as ‘active in the market economy’.)
The first chart focuses on older women, a group particularly impacted by recent and ongoing economic changes. Many of these people neither qualify for benefits when they become redundant; nor do they even make the official unemployment data because, compared to people aged 25 to 55, they are more often regarded as withdrawing from the labour force when they lose their jobs.
We can see that the post-1980s’ trend for all depicted age groups is one of rising ‘participation’ in the labour market; much of this is for financial reasons (eg needing to pay mortgages or rent), rather than for lifestyle or feminist reasons. Some of the change of course is linked to the increase of the age of entitlement to New Zealand Superannuation, from 60 to 65.
We see that recent (ie post-2022) data shows a flattening of the trend, or a fall against the trend for 65-69-year-old women. Most of these are actual unemployed people who are counted as ‘discouraged workers’ or ‘retired’. In reality, the financial pressures on older women to stay working are stronger than ever. 2022 represented the year of peak-grandmother-labour.
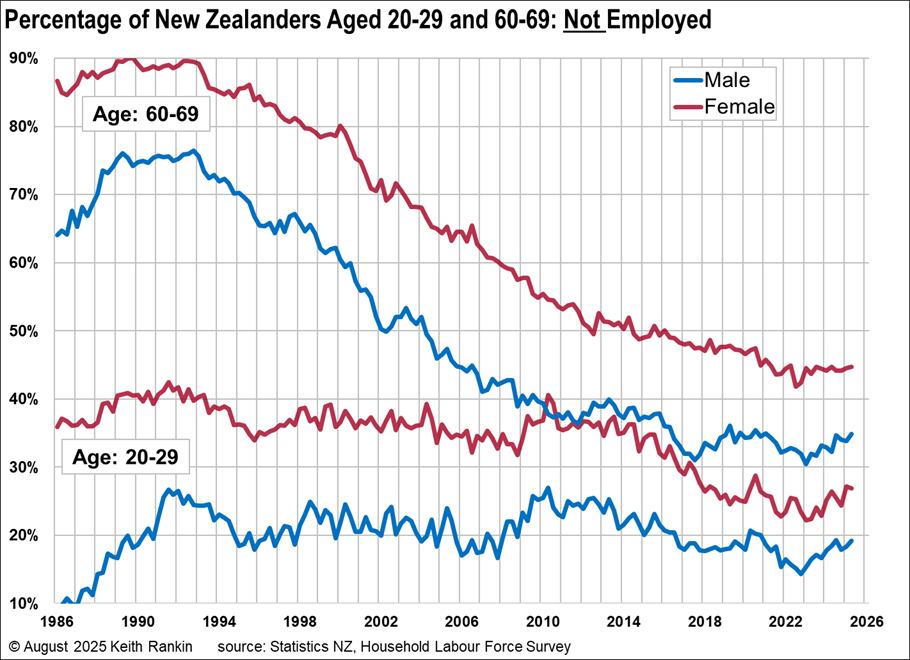 Chart by Keith Rankin.
The second chart shows the trend fall in older men and women NOT employed. We note that New Zealand Superannuation – a Universal Basic Income for Seniors – incentivises people to stay working after age 65. (Australia has a substantially lower proportion of people over 65 in employment.) The trend in falling non-employment has been arrested by the greater difficulty since 2022 in finding paid work.
For younger people, the trend is for more employment and less higher-education (although many people in higher education also meet the definition of being employed). It would appear that many New Zealanders in their twenties have returned to higher education in lieu of being employed, looking to live from student allowances or student loans.
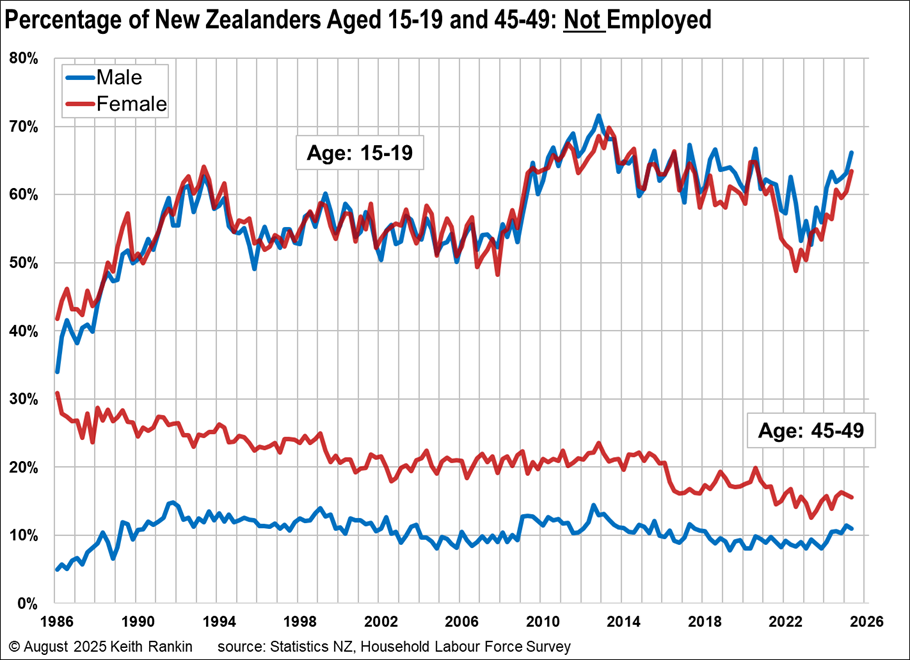 Chart by Keith Rankin.
The third chart compares the teenage workforce with workers of peak working age (45-49). For peak working age we see convergence of male and female participation, despite more women in their late forties with children aged under 10 in their care.
For teenage workers, the male data fluctuates more than the female data. In this decade, more teenage males are not employed than teenage females; a clear change from the 1980s. There was a dramatic ‘flight to employment’ for teenagers after covid; a return now reversed as the job market clams shut.
*******
Keith Rankin (keith at rankin dot nz), trained as an economic historian, is a retired lecturer in Economics and Statistics. He lives in Auckland, New Zealand.