
The results of microplastic quantity analysis in three types of studied ash, including bottom ash of the first chamber (FBA), bottom ash of the second chamber (SBA), and fly ash (FA) are shown in Table 1. In total 3491 particles of microplastics were counted. The results showed that the abundance of microplastics in the studied ashes had irregular spatial and temporal variations. As shown in Fig. 2, the abundance of microplastics in studied ash in Tehran Incinerator (TI) was higher than Nowshahr Incinerator (NI). On average, the abundance of microplastics in the FBA, SBA, and the FA of Tehran Incinerator compared to Nowshahr Incinerator were higher by 27 (14.13%), 21 (14.26%), and 21 (15.81%) particles/100 grams. 40% of the abundance of microplastics was observed in the FBA. The SBA and FA constituted 31.84% and 27.23% of the counted microplastics, respectively. Considering the total number, 53.92% of microplastics were counted in TI samples and 46.08% in NI samples. The abundance of microplastics in the studied ashes was not regular in different seasons. The highest microplastics in TI samples was observed in the summer season (27.57%), while it was 23.26%, 25.48%, and 23.49% in the spring, autumn, and winter, respectively. In NI, the highest microplastics was observed in spring (26.48%), while it was 24.48%, 23.27%, and 25.67% in summer, autumn, and winter, respectively. The abundance of microplastics in FBA, SBA and FA in TI samples was 40.85%, 31.62% and 27.43%, respectively, while in NI, it was 41.14%, 31.78%, and 26.98%, respectively.
Table 1 Abundance of microplastics in studied ashes (particle/100 grams).Fig. 2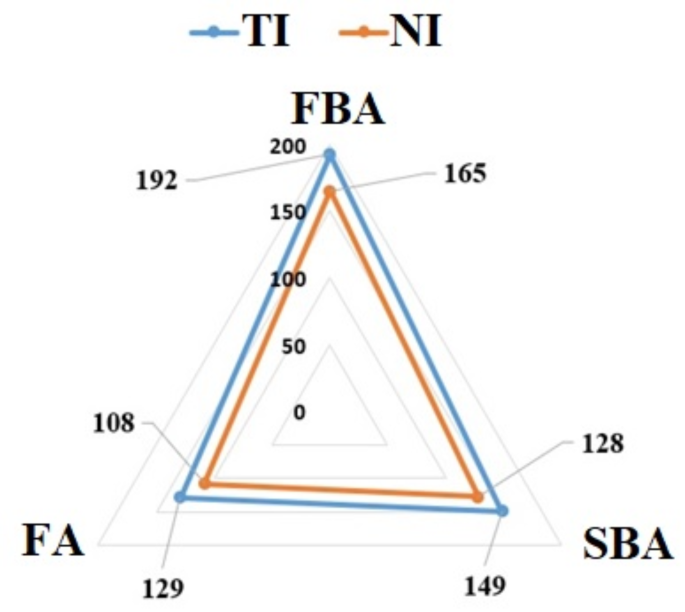
The average abundance of microplastics in the studied ashes (particles/100 grams).
Microplastics are one of the pollutants of concern in recent years, which, in addition to solid waste, have also been identified and reported in various media, including water sources27. The results showed that microplastic was a pollution in the studied ash samples. The presence of microplastics in the studied ashes is directly affected by the plastic wastes in the municipal waste mass11 which loaded in incinerator reactor with other waste compounds. Therefore, the abundance of microplastics in incinerator ash is affected by the proportion of loaded plastic waste in the reactor, which is different in different cities and countries11. However, the difference in the abundance of microplastics in the ash of the studied incinerators in Tehran and Nowshahr was due to the difference in the quantity and type of plastic loaded into the incinerators, which was due to the difference in the composition of municipal solid waste in Tehran and Nowshahr, as well as the difference in per capita waste production in the two studied cities. The factors affecting the number of microplastics in incinerator ash include the amount of plastic consumption and the ratio of separation of plastic waste from municipal solid waste. Plastic is a widely used in packaging, transportation, construction, electrical appliances, and many household appliances28. The characteristics of plastic, such as resistance, low price, and lightness, have caused its use to increase significantly in the past decades29, which has caused the increasing production of solid plastic waste30. An increase in plastic production from 1.5 million tons in 1950 to 245 million tons in 2008 was reported and it is estimated that the amount of plastic production in the world will increase by 5% annually28. Finally, some of the used plastics are turned into plastic waste. However, by proper management, it is possible to recycle more of the plastic waste and prevent it from being loaded into the incinerator.
The average per capita production of solid waste in Iran is 650 g/day and on average 8.4% of municipal solid waste includes plastic31. But, only 12% of plastic waste is recycled in Iran31, which directly affected the abundance of microplastics in incinerator ash. In this situation, the presence of microplastics in incinerator ash is expected due to loaded macro-plastics, which was seen in the results of this study. Although the decomposition of macro-plastics into secondary microplastics during the combustion process can be considered as the main affecting factor in microplastic aggregation in incinerator ash, it should be noted that the loaded waste mass can contain primary microplastics. For example, abundances of 20,000 to 91,000 microplastics per kilogram of solid waste in landfill sites was reported32. Therefore, it is expected that the loaded waste in the studied reactors had a significant number of primary microplastics. So, part of the observed microplastics in the ash of the studied incinerators are derived from primary microplastics in the mass of municipal solid waste, that influenced by the general conditions of waste management and the consumption pattern11. The affecting factors in the composition of municipal solid waste as well as environmental pollution can also be considered as indirect factors affecting the abundance of microplastics in incinerator ash. For example, the management of littered plastic waste in public environments can be an important source of microplastics in the environment33. The effect of marine plastics as one of the most important littered wastes in the environment in increasing primary microplastics in seafood can be considered34. Therefore, waste management and citizens’ behavior in reducing waste littering can be effective in changing the abundance of microplastics in incinerator ash. A clear example of these sources is cigarette butts, which are produced from cellulose acetate reinforced with plastic, that known as source of microplastic35,36,37.
The results of Raman analysis showed that investigated microplastics in the studied ashes has originated from six types of plastic polymers. These polymers included polypropylene, high-density polyethylene, low-density polyethylene, polyvinyl chloride, polystyrene, and polyethylene terephthalate. As shown in Fig. 3, polyvinyl chloride has the highest ratio (35.51%) and then polypropylene (21.66%), high density polyethylene (8.23%), low density polyethylene (10.94%), polystyrene (16.53%) and polyethylene terephthalate (7.35%). The size distribution of detected microplastics in the studied ashes is shown in Table 2. In total, 65.32% of the detected microplastics were less than 10 micrometers in size. 21.21% were between 10 and 100 microns and 13.56% were larger than 100 microns. The abundance of microplastic sizes as shown in Fig. 4, indicated that the ratio of the abundance of different sizes of detected microplastics in all types of ash and also in studied incinerators had the same pattern.
Fig. 3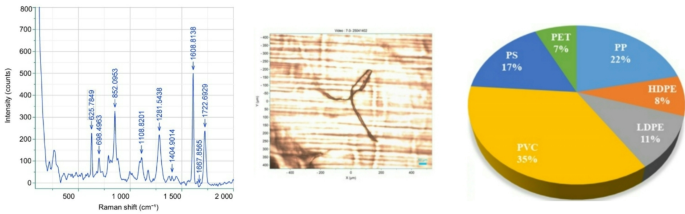
Types and proportion of polymers in detected microplastics.
Table 2 Size distribution of detected microplastics in the studied samples (particle/100 grams).Fig. 4
Size distribution (%) of microplastics in different ash samples: TI (A), NI (B).
As shown in Table 3 the color of microplastics in the studied ashes included blue (40.7%), red (32.8%), transparent (14.7%), green (6.3%) and others (1.5%). Also, the share of each form of microplastic was different in all types of ash, however, in all samples, the share of fiber-shaped microplastics was much higher than film-shaped and irregularly shaped microplastics. The total detected microplastics in TI samples included 996 fibers, 481 films, and 196 irregular shapes. While in NI samples, 1006 fibers, 518 films, and 407 irregular shapes were detected. Therefore, the highest number of detected microplastics were fiber (65.3%), film (31.6%), and irregular shapes (12.4%). As shown in Fig. 5, the detected microplastics had various morphologies and colors.
Table 3 Color and shape distribution of detected microplastics in the studied samples (particle/100 grams).Fig. 5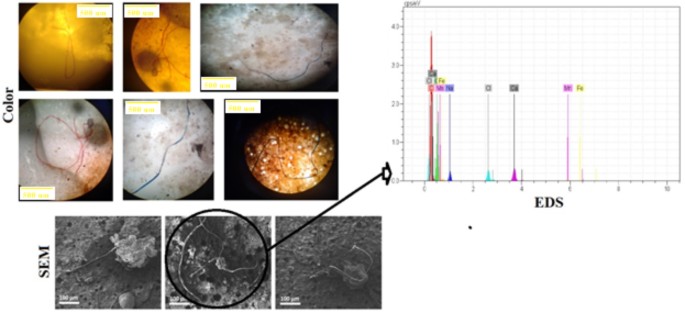
Photos of some detected microplastics in the ash and SEM/EDS results.
Considering the ability of microplastics to carry pollutants, in the analysis carried out to find polluting particles on the surface of identified microplastics, EDX combined with SEM was used for elemental analysis. The results of the aforementioned analysis for a sample of microplastics are given in Fig. 5. The results showed that there was a high percentage of metals (iron, manganese, calcium, etc.), along with carbon, sodium and chlorine in the surface of the sample. The variety of plastic types in the composition of plastic waste as well as difference in primary microplastic sources in the municipal solid waste had the main effect on the observed variation of shape, size, and color of microplastic in the studied ashes. Plastic morphology is effective in its decomposition and fate in the environment and in waste management processes38. Referring to many studies, the difference in the type, shape and size of microplastics in the municipal solid waste, which is as a result of the variety of plastic consumption in the community, has a reason for the observed differences in this study11. Therefore, the variety and contribution of each of the plastics observed in the ash was directly affected by the quantity of the types of plastic in the loaded waste.
The difference in the shape of the microplastics observed in the studied ashes was directly influenced by the difference in the shape of the primary microplastics in the waste mass loaded into the reactor and indirectly by the combustion process on the loaded plastic waste. The presence of microplastics in solid wastes has been reported in various shapes of particles, fibers, plates, granules, and irregular shapes39, which was consistent with the results of this study. However, the proportion of the contribution of each of the microplastic shape in the solid waste and the subsequent in the incinerator ash depend on the proportion of the shape of initial microplastic and also the effect of the combustion process in changing the shape of the loaded plastic waste in the reactor that may be different in different samples. Based on this, the difference in the size of observed microplastics in the studied ashes can also be interpreted. In various studies, the size of primary microplastics in municipal solid waste has been reported in the range of 0.02 to 4.9 mm40, which can be observed in the same proportion in incinerator ash. Also, the effect of the morphology of loaded plastic waste in the incinerator reactor on their fate during the combustion process and the formation of different sizes microplastics was one of the reasons for the observed different size24.
Plastic is a widely used in packaging, transportation, construction, electrical appliances, and many household appliances28. The characteristics of plastic, such as resistance, low price, and lightness, have caused its use to increase significantly in the past decades29, which has caused the increasing production of solid plastic waste30. An increase in plastic production from 1.5 million tons in 1950 to 245 million tons in 2008 was reported and it is estimated that the amount of plastic production in the world will increase by 5% annually28. Finally, some of the used plastics are turned into plastic waste. However, by proper management, it is possible to recycle more of the plastic waste and prevent it from being loaded into the incinerator.
The average per capita production of solid waste in Iran is 650 g/day and on average 8.4% of municipal solid waste includes plastic31. But, only 12% of plastic waste is recycled in Iran31, which directly affected the abundance of microplastics in incinerator ash. In this situation, the presence of microplastics in incinerator ash is expected due to loaded macro-plastics, which was seen in the results of this study. Although the decomposition of macro-plastics into secondary microplastics during the combustion process can be considered as the main affecting factor in microplastic aggregation in incinerator ash, it should be noted that the loaded waste mass can contain primary microplastics. For example, abundances of 20,000 to 91,000 microplastics per kilogram of solid waste in landfill sites was reported32. Therefore, it is expected that the loaded waste in the studied reactors had a significant number of primary microplastics. So, part of the observed microplastics in the ash of the studied incinerators are derived from primary microplastics in the mass of municipal solid waste, that influenced by the general conditions of waste management and the consumption pattern11. The affecting factors in the composition of municipal solid waste as well as environmental pollution can also be considered as indirect factors affecting the abundance of microplastics in incinerator ash. For example, the management of littered plastic waste in public environments can be an important source of microplastics in the environment33. The effect of marine plastics as one of the most important littered wastes in the environment in increasing primary microplastics in seafood can be considered34. Therefore, waste management and citizens’ behavior in reducing waste littering can be effective in changing the abundance of microplastics in incinerator ash. A clear example of these sources is cigarette butts, which are produced from cellulose acetate reinforced with plastic, that known as source of microplastic35,36,37.