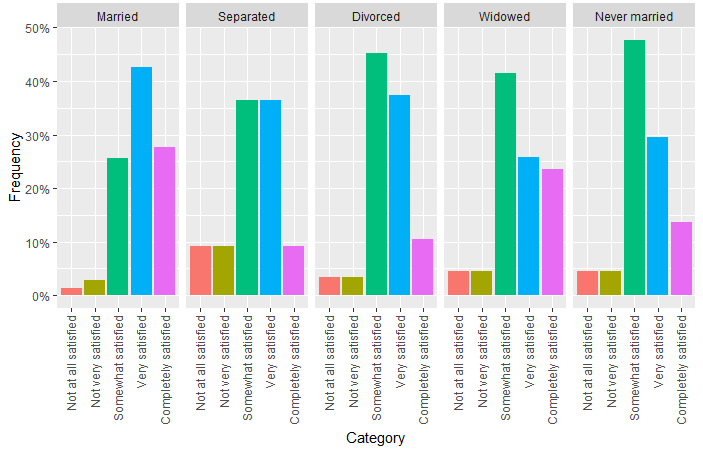
Data was obtained from the Americans' Changing Lives Survey (data publicly available at this link), a longitudinal study conducted by the University of Michigan which surveyed study participants from 1989 to 2019. I am only using data from the most recent year, 2019. All respondents fell into one of the five categories shown here.
Median age of respondents in 2019 was 61 years old; 25th and 75th percentiles were 55 and 69 years of age, respectively. Total number of respondents was 957; 698 were married, 11 separated; 115 divorced; 89 widowed; 44 never married.
Posted by Nillavuh
20 comments
Analysis and plot generation performed in R.
These numbers are often dramatically different for men and women.
Widowers are suspiciously very happy
Cool data! Though I think the cause and consequence are the other way around;
People with secure job, stable mental/physical health, good human relationships are more likely to get married(and stay married) so they are more likely to be happy I think.
I guess that’s also the reason widows are more likely to be happy than other groups.
I imagine people going through separation are highly depressed, so this tracks.
Wonder how this changes with kids controlled for.
Not seeing a gender breakdown here….
I would like to break this up by gender assuming heterosexual couples. Please and thank you. 🥲
I was expecting arranged marriages on a separate table.
I find the colours of the different bars hard to follow.
The data doesn’t fully represent each sample size. At face value you could say the Never Married group has overall greater life satisfaction at over ~50% or higher but that is only representative of the 44 people out of 950 where as the Married group is less overall percentage around ~42% or higher but their group size is 698 out of 950. You would want to have an equal distribution of Married to Never Married people to measure any correlative effects.
I’d be curious to see breakdown of Dirvorced split into groups by how many years divorced and/or by how satisfied or happy they are about divorce. Another factor would be acrimonious divorce/custody issues are (decent Co-parenting/low conflict vs high conflict and bad fight over assets vs ok/satisfacton/ no real battle)). I’m betting each one of these would see very different stats on satisfaction based on where things stand/how much conflict. Ditto separation. Lumping them all together likely is misleading. Even years divorced— heartbreaking/ huge life upheaval is a big factor in first few years. It settles later for most.
I’m really struggling to find the info on the website; does anyone understand how to navigate it?
Married, Widowed, never married, divorced, Seperated.
If I’m eyeballing it correctly, those are the groups, highest to lowest, in the completely satisfied/very satisfied category?
Hm……
Interesting I’ve always heard that people who never marry are not as happy as those that do. I vaguely remember seeing a graph comparing happiness across time that shows unmarried people become very unhappy as they age. I’m going to look into this data aswell. Thank you !
I’d like to see a breakdown by gender
Since when did this sub become “data is interesting?” This has absolutely nothing to do anymore with beautiful data. It’s just an ugly boring bar chart with just the info that’s interesting. That’s not what this sub is supposed to be about.
I feel like being satisfied with one’s married life is what keeps people married.
Split by gender and you’ll see something depressing…
So, it’s actually better to not have loved after all…
Never married has to be separated into two categories – never married, but want(ed) to; and never wanted to get married.
Comments are closed.