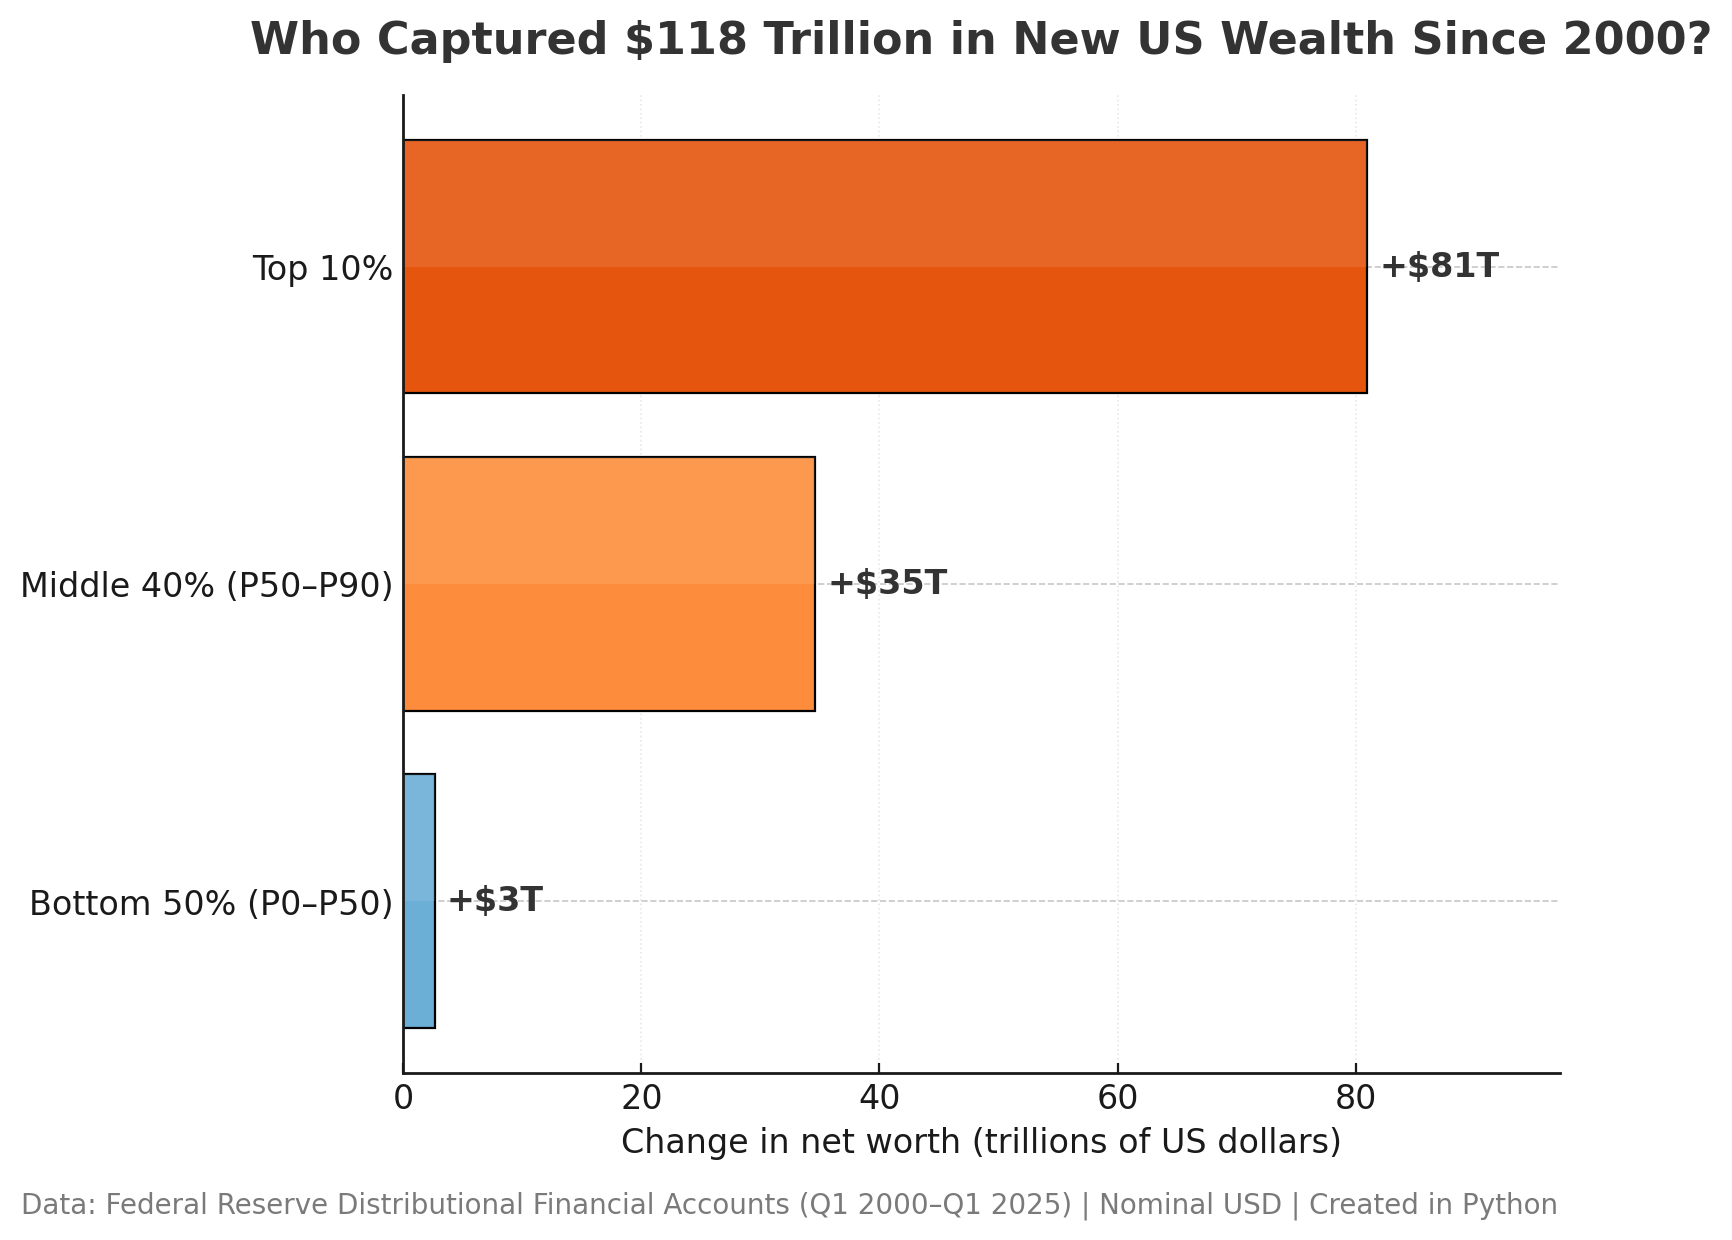
If all distributed equally among the US population today, that would be $350,000 per person
Would be interesting to see this per capita, the amount of wealth each group gains is probably relative to the amount of wealth they already have.
FYI—your assets didn’t increase in value, your money simply became worth less.
Can we not say “captured,” as if it were wealth taken from a static pool somewhere and then hoarded, rather than created and promptly invested in other people/the machinery of the economy? Title is unnecessarily misleading
“Middle 40%” is not ‘middle’ if it sits above half of what is measured.
Fuck yea bottom!! 3 trillion is no small amount!
Now, let’s see how many people each grouping represents, and the resulting increase per person.
I’ll take a wild guess, and speculate that the bottom 50% did not win.
While the story here is the disparity, that’s $45k per household for the bottom 50% still seems high. Median household net worth in the us is only $192k.
The middle 50% gained $662k per household as well, which is probably heavily weighted to the top end but still seems really high for that bracket.
I think using all deciles might actually make a better graphic, because I suspect there is a top heavy skew in each of the lower two groups
Edit: looking at the data, the bottom 50% more than tripled their wealth since 2017. It has been relatively huge gains there.
The 2008 GFC did enormous damage to the bottom 50%
Many lost their life saving and homes
I know families who spent $300k on a 50% down (to qualify for the mortgages because their income was not high) payment in 2006, then lost their job 2 years later and had their homes foreclosed with no equity left
Just horrible
Real estate bubbles are very very bad things, far more so than equity bubbles
This graphic tells me that long term capital gains should be taxed as regular income.
Fiat currency is not a measure of wealth, but of debt. Thus the question is worded poorly. Who captured $118 trillion of US Household debt since 2000.
To clarify, this is not a prospective-looking cohort analysis, like it doesn’t say that people who were in the Top 10% *in 2000* captured +81T, it’s just looking at the size of wealth increase in terms of today’s Top 10% vs. 2000’s Top 10%, it doesn’t account for people moving from one group to another over time. I’d be way more interested in a cohort analysis, as many people who ended up in the top group started in the bottom group in 2000 and some people in the top in 2000 then also lost it, but I’ve never seen a dataset that could possibly help illustrate wealth dynamics over time this way.
Boss makes a dollar, I make a dime, that’s why I . . .
What is funny if you think about it, even if we gave people in the lower some more wealth, they would just spend it giving it back to the to 10%.
It is just a vicious cycle.
Add in all this “new found wealth” would just cause more inflation so in 5 years here we all sit piss ass broke but now we have an extra zero in our income
Oy vey, cool it with the antisemitic comments!
Hmm, so not immigrants or trans people causing the problems then.
People think wealth inequality is a tax problem. It’s not a tax problem, it’s a money printing problem.
Tax receipts as a percentage of GDP has pretty much been flat since WW2 ([Federal Receipts as Percent of Gross Domestic Product (FYFRGDA188S) | FRED | St. Louis Fed](https://fred.stlouisfed.org/series/FYFRGDA188S)).
Rich people don’t make their wealth through income, their wealth doesn’t sit in dollars in a bank account. Their wealth sits in assets that get valued in dollars because dollars are the measuring stick for wealth. Their wealth goes up when the federal reserve prints money out of thin air, calls it a fancy term like quantitative easing, and buys all their assets, inflating the market value of their prices. On top of that, they set short term interest rates to near zero for over a decade, allowing the rich to borrow money (which is also a form of money printing through the commercial banking sector) to buy even more assets.
Meanwhile, the average person trades their time and energy to get a paycheck in dollars, the same dollars that the federal reserve prints for nothing, or rich people get to borrow for nothing. Inflation is too much currency chasing too few goods. The only time the average person noticed inflation was when groceries became too expensive because the government simultaneously airdropped money into everyone’s bank accounts, and shut down all the supply chains. Before any of that even happened, financial assets like stocks, bonds, and real estate (none of which the bottom 50% own) were inflating at astronomical rates since 2008 (and went into overdrive after COVID) because of QE (quantitative easing) and ZIRP (zero interest rate policy).
Wow, the top wealth creators created a lot of wealth
Wow your Microsoft excel graph is so beautiful !! Retard
It would be interesting to see how this compares to taxes paid and received. But I don’t really care about how wealth is distributed, just that quality of life measures are improving for all groups.
The top 10% could be broken down further. Maybe 10, 5, 2, 1, and 0.1%.
A person making >175k a year is top 10% and >300k is top 5%.
It looks like this chart is just looking at the before and after wealth of the various wealth percentiles.
It gives the idea that there was no social movement. A poor person become rich is not possible to see here, because they’d be part of the rich tranche.
Ofc, the chart is clearly showing the outsized effects of gains falling on the rich. No doubt about that.
And the fallacy is in thinking that the top x% in 2025 are the same individuals as in 2000. The shown data is entirely consistent with the richest in 2000 losing all their wealth by 2025.
![Who Captured $118 Trillion in New US Household Wealth Since 2000 [OC]](https://www.europesays.com/wp-content/uploads/2025/08/9t7tzznrl0if1-1732x1024.png)
23 comments
If all distributed equally among the US population today, that would be $350,000 per person
Would be interesting to see this per capita, the amount of wealth each group gains is probably relative to the amount of wealth they already have.
FYI—your assets didn’t increase in value, your money simply became worth less.
Can we not say “captured,” as if it were wealth taken from a static pool somewhere and then hoarded, rather than created and promptly invested in other people/the machinery of the economy? Title is unnecessarily misleading
“Middle 40%” is not ‘middle’ if it sits above half of what is measured.
Fuck yea bottom!! 3 trillion is no small amount!
Now, let’s see how many people each grouping represents, and the resulting increase per person.
I’ll take a wild guess, and speculate that the bottom 50% did not win.
While the story here is the disparity, that’s $45k per household for the bottom 50% still seems high. Median household net worth in the us is only $192k.
The middle 50% gained $662k per household as well, which is probably heavily weighted to the top end but still seems really high for that bracket.
I think using all deciles might actually make a better graphic, because I suspect there is a top heavy skew in each of the lower two groups
Edit: looking at the data, the bottom 50% more than tripled their wealth since 2017. It has been relatively huge gains there.
The 2008 GFC did enormous damage to the bottom 50%
Many lost their life saving and homes
I know families who spent $300k on a 50% down (to qualify for the mortgages because their income was not high) payment in 2006, then lost their job 2 years later and had their homes foreclosed with no equity left
Just horrible
Real estate bubbles are very very bad things, far more so than equity bubbles
This graphic tells me that long term capital gains should be taxed as regular income.
Fiat currency is not a measure of wealth, but of debt. Thus the question is worded poorly. Who captured $118 trillion of US Household debt since 2000.
To clarify, this is not a prospective-looking cohort analysis, like it doesn’t say that people who were in the Top 10% *in 2000* captured +81T, it’s just looking at the size of wealth increase in terms of today’s Top 10% vs. 2000’s Top 10%, it doesn’t account for people moving from one group to another over time. I’d be way more interested in a cohort analysis, as many people who ended up in the top group started in the bottom group in 2000 and some people in the top in 2000 then also lost it, but I’ve never seen a dataset that could possibly help illustrate wealth dynamics over time this way.
Boss makes a dollar, I make a dime, that’s why I . . .
What is funny if you think about it, even if we gave people in the lower some more wealth, they would just spend it giving it back to the to 10%.
It is just a vicious cycle.
Add in all this “new found wealth” would just cause more inflation so in 5 years here we all sit piss ass broke but now we have an extra zero in our income
Oy vey, cool it with the antisemitic comments!
Hmm, so not immigrants or trans people causing the problems then.
People think wealth inequality is a tax problem. It’s not a tax problem, it’s a money printing problem.
Tax receipts as a percentage of GDP has pretty much been flat since WW2 ([Federal Receipts as Percent of Gross Domestic Product (FYFRGDA188S) | FRED | St. Louis Fed](https://fred.stlouisfed.org/series/FYFRGDA188S)).
90% of all dollars ever created was printed in the last 15 years ([M1 (M1SL) | FRED | St. Louis Fed](https://fred.stlouisfed.org/series/M1SL)).
Rich people don’t make their wealth through income, their wealth doesn’t sit in dollars in a bank account. Their wealth sits in assets that get valued in dollars because dollars are the measuring stick for wealth. Their wealth goes up when the federal reserve prints money out of thin air, calls it a fancy term like quantitative easing, and buys all their assets, inflating the market value of their prices. On top of that, they set short term interest rates to near zero for over a decade, allowing the rich to borrow money (which is also a form of money printing through the commercial banking sector) to buy even more assets.
Meanwhile, the average person trades their time and energy to get a paycheck in dollars, the same dollars that the federal reserve prints for nothing, or rich people get to borrow for nothing. Inflation is too much currency chasing too few goods. The only time the average person noticed inflation was when groceries became too expensive because the government simultaneously airdropped money into everyone’s bank accounts, and shut down all the supply chains. Before any of that even happened, financial assets like stocks, bonds, and real estate (none of which the bottom 50% own) were inflating at astronomical rates since 2008 (and went into overdrive after COVID) because of QE (quantitative easing) and ZIRP (zero interest rate policy).
Wow, the top wealth creators created a lot of wealth
Wow your Microsoft excel graph is so beautiful !! Retard
It would be interesting to see how this compares to taxes paid and received. But I don’t really care about how wealth is distributed, just that quality of life measures are improving for all groups.
The top 10% could be broken down further. Maybe 10, 5, 2, 1, and 0.1%.
A person making >175k a year is top 10% and >300k is top 5%.
It looks like this chart is just looking at the before and after wealth of the various wealth percentiles.
It gives the idea that there was no social movement. A poor person become rich is not possible to see here, because they’d be part of the rich tranche.
Ofc, the chart is clearly showing the outsized effects of gains falling on the rich. No doubt about that.
And the fallacy is in thinking that the top x% in 2025 are the same individuals as in 2000. The shown data is entirely consistent with the richest in 2000 losing all their wealth by 2025.
Comments are closed.