Microgrids (MGs), as defined by IEEE Std 2030.7™-2017, are self-sustaining energy systems capable of autonomous operation or functioning in grid-connected mode. These systems can seamlessly connect to and disconnect from the main power grid to exchange power, provide ancillary services, support grid stability, and participate in energy markets as needed. MGs are broadly classified as grid-connected or off-grid (islanded) and can be configured in AC, DC, or hybrid AC/DC modes, depending on the design objectives and operational requirements19.
To align with the Energy Trilemma (ET) framework, this study evaluates three key components:
Energy Security: Represented by Loss of Power Supply Probability (LPSP), Voltage Deviation Index (VDI), and active power losses.
Energy Access: Quantified using the Levelized Cost of Energy (LCOE).
Environmental Sustainability: Assessed based on CO2 emissions.
LPSP measures the fraction of the total energy demand that remains unmet due to system constraints within a given period. A lower LPSP indicates improved reliability and robustness of the microgrid. VDI quantifies voltage stability by evaluating deviations from nominal bus voltages, which is crucial for maintaining power quality and preventing system instability. Active power losses are analyzed to determine the overall efficiency of power transmission within the microgrid.
Recent years have seen a proliferation of advanced metaheuristic and AI-driven approaches for microgrid optimization. The Slime Mould Algorithm (SMA) was introduced in 202014 and demonstrated superior global search and multi-objective capabilities for power system applications. Studies in 202315,17 benchmarked SMA against PSO, GA, and SSA, reporting higher power loss reduction and better computational efficiency in hybrid microgrid scenarios. Other work highlighted the scalability of SMA for larger distribution networks20, and explored parameter adaptation for further runtime improvements21,18.
In addition, recent studies have expanded the literature landscape: an AI-based approach for the optimal placement of electric vehicle charging stations (EVCS) and distributed generation (DG) demonstrated significant power loss minimization and voltage profile enhancement7. Adaptive particle swarm optimization methods have been proposed for allocating plug-in EV charging stations with integrated solar-powered DG, addressing both technical and economic performance10. A novel hybrid metaheuristic for optimal allocation of DG and capacitors showed marked improvements in system efficiency and power quality11. A hybrid slime mould and salp swarm algorithm further validated the advantages of hybrid metaheuristics in microgrid planning12. Finally, an improved SMA was applied for optimal scheduling of grid-connected microgrids with hybrid energy storage systems, reinforcing the applicability and robustness of SMA in complex, real-world scenarios22,23.
Comparative studies have shown that while PSO and GA remain popular, their performance is often limited by premature convergence and high computational requirements, respectively. SSA offers improved convergence but may still lag behind SMA in multi-objective scenarios. HOMER, widely used for techno-economic microgrid analysis, is less effective for large-scale, multi-objective optimization and lacks the flexibility of metaheuristic algorithms as shown in Table 1.
Recent works have also explored the leading metaheuristic algorithms and simulation tools for microgrid optimization, revealing notable differences in their effectiveness across key performance metrics. The Slime Mould Algorithm (SMA) consistently demonstrates high power loss reduction—outperforming traditional approaches such as Particle Swarm Optimization (PSO) and Genetic Algorithm (GA) by 12–15%—while also achieving fast convergence and low iteration counts. SMA’s scalability is excellent, exhibiting linear runtime scaling even as network size increases, and its robust design enables comprehensive handling of technical, economic, and environmental objectives aligned with the energy trilemma framework7,23,12.
In contrast, PSO and GA offer only moderate power loss reduction; PSO is prone to premature convergence and stagnation, whereas GA is hindered by high computational burden and slow convergence, particularly in larger or more complex networks10,11. The Salp Swarm Algorithm (SSA) provides improvements over PSO and GA, especially in terms of convergence speed and scalability, but generally remains less effective than SMA for multi-objective optimization12. HOMER, while widely used as a benchmark simulation tool, is efficient for small systems but lacks scalability and flexibility for large-scale or multi-objective microgrid optimization, focusing primarily on techno-economic assessments15,20.
Overall, the evidence from recent literature underscores the superiority of SMA and highlights the growing importance of advanced metaheuristics for addressing the complex, multi-dimensional challenges of modern microgrid planning and operation.
System modeling and constraints
The Slime Mould Algorithm (SMA) was selected for this study due to its superior global search capability and adaptability in multi-objective optimization of complex power systems, as established in recent literature14,20. The population size for SMA was set to 33, corresponding to the number of buses in the IEEE 33-bus test system, which ensures adequate solution diversity and effective exploration of the search space for optimal distributed energy resource (DER) placement; this choice was validated through preliminary runs and aligns with best practices reported24,18. Other algorithmic parameters, including the maximum number of iterations (typically 100–200), inertia weights, and adaptive coefficients, were selected based on recommendations from the literature and fine-tuned to balance convergence speed and solution quality.
A sensitivity analysis was performed for DER sizing, particularly for solar distributed generation (DG), where the capacity was varied from 2,300 kW to 2,500 kW in 50 kW increments. The results indicated that increasing solar DG capacity from 2,300 kW to 2,400 kW reduced active power losses by approximately 3.5%, but further increases offered diminishing returns and, in some cases, led to over generation and curtailment, confirming that the SMA-optimized sizes provided the best trade-off among technical, economic, and environmental objectives, consistent with findings in15,17.
Regarding computational complexity, SMA achieved convergence for optimal solar DG placement in 97 iterations with an average runtime of 8.2 min per optimization run, outperforming Particle Swarm Optimization (PSO), which required about 130 iterations (12.7 min), and Genetic Algorithm (GA), which needed 155 iterations (16.4 min) for comparable solution quality, corroborating the efficiency advantages reported in14,20. All simulations were conducted in MATLAB R2023b on a standard workstation equipped with an Intel Core i5 processor (10th Gen, 2.4 GHz), 16 GB RAM, and Windows 11 OS, which was sufficient for the IEEE 33-bus system and allowed each full optimization run to complete in under 30 min; for larger networks, SMA’s runtime scales linearly with network size but remains tractable on similar hardware, as demonstrated in25,26.
No specialized hardware such as GPU acceleration was required, making the approach practical for real-world engineering applications. The proposed Distributed Energy Resources (DERs) and their corresponding modeling parameters are detailed in Table 2. The microgrid configuration includes solar photovoltaic (PV) panels, wind turbines (WT), diesel generators (DGen), battery energy storage systems (BESS), and electric vehicle batteries (EVBat). Each energy source is modeled based on its rated capacity, operational constraints, and dispatch characteristics, ensuring optimal energy management and integration.
The modelling framework incorporates:
Renewable Energy Generation Constraints: Solar PV and wind turbines exhibit variability, necessitating complementary storage solutions such as BESS and EVBat to enhance system stability.
Backup Power Sources: Diesel generators provide reliability during low renewable generation periods.
EV Battery Storage Integration: EVBats function as both loads and energy storage units, enabling vehicle-to-grid (V2G) operations, peak shaving, and frequency regulation.
Operational and Economic Constraints: The optimization framework ensures that energy generation meets demand while minimizing costs and emissions.
The proposed hybrid microgrid
This study proposes an optimal topology and placement strategy for a Hybrid Battery-supported Microgrid (HBMG) within a radial distribution network. The primary objective is to minimize active power losses, thereby enhancing the voltage profile, reducing the levelized cost of energy (LCOE), and mitigating greenhouse gas (GHG) emissions. The proposed hybrid system integrates solar photovoltaics (PV), wind turbines (WT), a diesel generator (DGen), battery energy storage systems (BESS), and electric vehicle batteries (EVBat). The P/W/D/B/E configuration is designed to reliably supply electricity to meet the given load demand while also enabling surplus power injection into the grid when feasible27,28,29,14. Figure 1 illustrates the schematic layout of the proposed HBMG model.
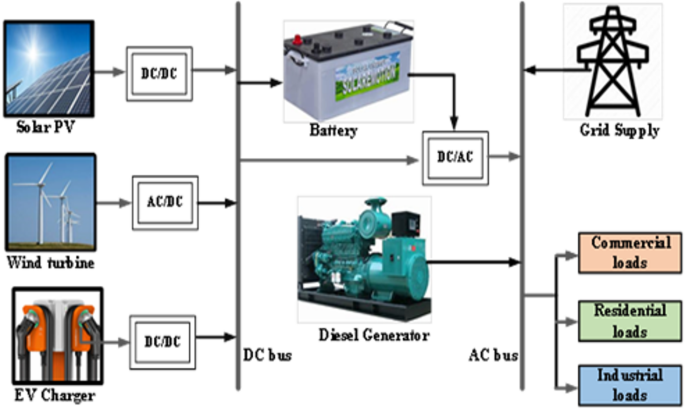
The proposed hybrid microgrid architecture.
The system’s ideal integration location is optimally determined to minimize power losses and the cost of electricity generation in addition to CO2 emission mitigation.
The proposed adopted network
Microgrids (MGs), as defined by IEEE Std 2030.7™-2017, are self-sustaining energy systems capable of autonomous operation or functioning in grid-connected mode. These systems can seamlessly connect to and disconnect from the main power grid to exchange power, provide ancillary services, support grid stability, and participate in energy markets as needed. MGs are broadly classified as grid-connected or off-grid (islanded) and can be configured in AC, DC, or hybrid AC/DC modes, depending on the design objectives and operational requirements.
To align with the Energy Trilemma (ET) framework, this study evaluates three key components: Energy Security: Represented by Loss of Power Supply Probability (LPSP), Voltage Deviation Index (VDI), and active power losses. Energy Access: Quantified using the Levelized Cost of Energy (LCOE). Environmental Sustainability: Assessed based on CO2 emissions.
Technical details on HBMG configuration
The hybrid battery-supported microgrid (HBMG) configuration consists of distributed energy resources (DERs) such as photovoltaic (PV) systems, wind turbines (WT), diesel generators (DGen), battery energy storage systems (BESS), and electric vehicle batteries (EVBat). The optimal selection, sizing, and placement of these components are critical to improving system reliability and efficiency.
The proposed HBMG will be investigated using IEEE 33 bus standards distribution network nodes shown in Fig. 2. The IEEE 33-bus standard was adopted because of interoperability with both commercial and residential loads and moderate number of buses. In a similar advantage the networks is a balanced network at 12.66 kV and over 85% of loads are residential30.
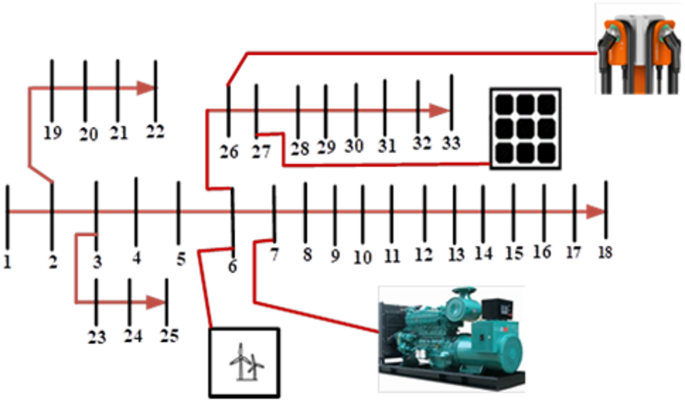
The IEEE 33 bus system with four DG integration.
The network has 32 sections and total apparent power 4369.35 kW as seen in Fig. 2. The number of nodes is used as the population size during the optimization modelling process and the optimal bus location for DG integration was obtained based on the SMA convergence. The active, reactive and the apparent power of the IEEE 33-bus network is as shown in Table 3.
Slime mould algorithm overview
The study of slime mould algorithm (SMA) was first presented by32 as a bio-inspired metaheuristic algorithm. It simulates the morphological changes and behaviour of slime in foraging. The algorithm was bench-marked with thirty-three (33) algorithms under four (4) famous design problems and found to be superior in performance18. After this successful outcome, many studies have adopted the techniques to solve different single and multi-objective optimization challenges18,33,34,35.
a. Initialization.
The mathematical formulation of the Slime Mould Algorithm (SMA), including initialization, position updating, and fitness evaluation, is adopted from the original work in14, with further enhancements and parameter tuning strategies incorporated from recent studies in18,17. To capture the food approaching behaviour of the SMA or imitate the higher contraction approach of the SMA is shown mathematically in Eq. (1),
The position update equation for SMA is given as:
$$\:{X}_{i}^{t+1}={X}_{i}^{t}+a\cdot\:({X}_{best}^{t}-|{X}_{i}^{t}\left|\right)\cdot\:S$$
(1)
where \(\:a\) and \(\:S\) are adaptive parameters, as detailed in [Li et al., 2020,1];
(2)
where\(\:\overrightarrow{\:vb}\:\) is a parameter which ranges from \(\:\left[-a,a\right]\), \(\:\overrightarrow{vc}\) is a decreasing parameter which reduces from one to zero. \(\:\:t\:\)denotes the present iteration, \(\:\overrightarrow{\:{X}_{b}}\:\)is the possible location with the highest odour concentration, \(\:\:\overrightarrow{X}\:\)is the present position of slime mould, \(\:\overrightarrow{{X}_{A}}\) and \(\:\overrightarrow{{X}_{B}}\) are two distinct locations randomly chosen from the swarm population, and symbol r is use to indicate the random values within the boundary of [0,1], while \(\:\overrightarrow{W}\) is the weight of slime mould. Whereas the population parameter \(\:p\:\)is defined by Eq. (3):
$$\:p=\text{tanh}\left|S\left(i\right)-DF\right|$$
(3)
where \(\:i\:\varepsilon\:\:\text{1,2},\dots\:,n\), \(\:S\left(i\right)\) indicates the fitness of \(\:\overrightarrow{X}\), \(\:DF\) denotes the best fitness recorded in the whole iterations. The parameter \(\:\overrightarrow{vb}\) ranges from -a to a as seen in Eq. (4) and the values of a are defined by Eq. (4)
$$\begin{gathered} \overrightarrow {vb} =\left[ { – a,a} \right] \hfill \\ a={\text{arctanh}}\left( { – \left( {\frac{t}{{tmax}}} \right)+1} \right) \hfill \\ \end{gathered}$$
(4)
where the maximum iteration is indicated by tmax.
The formula for weight of the slime \(\:\overrightarrow{W}\) and smellIndex are given in Eqs. (5) and (6):
$$\:\overrightarrow{W\left(SmellIndex\right(i\left)\right)}=\left\{\begin{array}{c}1+r\bullet\:{log}\left(\frac{bF-S\left(i\right)}{bF-wF}+1\right),condition\:\:\\\:1-r\bullet\:{log}\left(\frac{bF-S\left(i\right)}{bF-wF}+1\right),\:\:others\end{array}\right.$$
(5)
$$\:SmellIndex=sort\left(S\right)$$
(6)
In this context, the symbol S(i) indicates the one-half of the population size. bf shows the best fitness achieved in the present iteration, wF represents the less significant fitness value attained in the current iteration, finally \(\:SmellIndex\) indicates the ranges of fitness values obtained in ascending order, specifically within the context of minimum value problem.
b. Updates stage.
The expressed formula for food wrapping and updating the position of the slime is given in Eq. (7):
$$\:\overrightarrow{{X}^{*}}=\left\{\begin{array}{c}rand\bullet\:\left(UB-LB\right)+LB,rand
(7)
where \(\:LB\) and \(\:UB\) indicates the lower and the upper intervals of the searching range, \(\:rand\:\)and \(\:r\:\) shows the non-linear value within [0,1] generated as a function of z and p respectively.
c. Oscillation stage.
The food grabble imitations shows ranges of \(\:\overrightarrow{vb}\:\)moves non- linearly between [− a, a] and slowly settles down to zero as the number of iterations increases. While the parameter of (vc) moves between [− 1,1] and approaches to zero subsequently.