CORRECTED VERSION – Thank you for the feedback!
This is a corrected version of my previous RAI visualization. Special thanks to u/quitefondofdarkroast and u/Deto for their sharp observations that helped identify calculation errors in my original dataset. Their feedback on Texas and Ohio's scores led me to do a complete verification of all 50 states.
What was fixed:
- Recalculated all RAI scores from scratch using verified source data
- Corrected House delegation counts (e.g., New York had 7 Republicans, not 11)
- Double-checked calculations against multiple examples
Key findings remain the same: Single-representative states tend to show the highest misalignment due to winner-take-all effects, while larger states generally show better proportional representation.
The methodology is sound – it was my execution that needed improvement. This is exactly why peer review matters in data analysis!
Posted by HCMXero
2 comments
**Data Sources:**
* 2024 Presidential Election Results: Federal Election Commission (https://www.fec.gov/documents/5644/2024presgeresults.pdf)
* Current House of Representatives composition: Wikipedia List of Current U.S. Representatives and official House records
**Tool:** Datawrapper
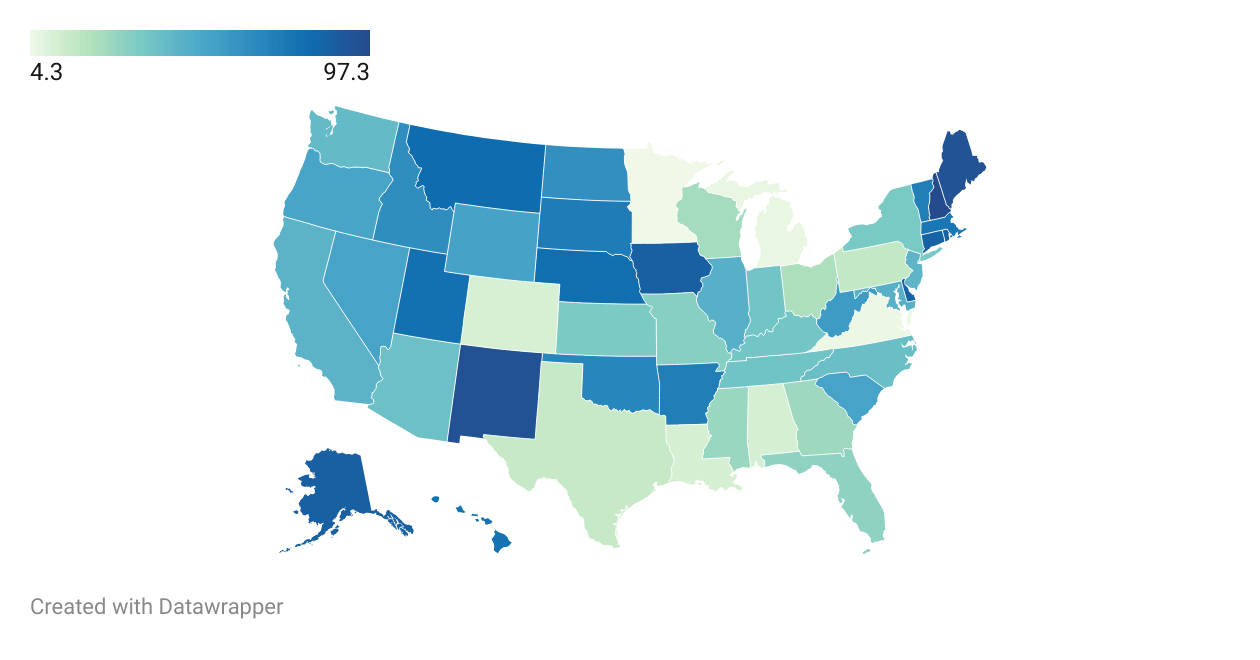
**Methodology:** The Representational Alignment Index (RAI) measures the absolute difference between a state’s presidential vote margin and its House delegation partisan composition. RAI = |Presidential Margin – House Margin|, where Presidential Margin = Trump% – Harris% and House Margin = Republican seat% – Democratic seat%. A score of 0 represents perfect alignment, while higher scores indicate greater misalignment between voter preferences and representation.
**Key Findings:** Single-representative states show the highest misalignment (Alaska 86.8, Wyoming 53.5) due to winner-take-all effects. Best aligned states include ~~Maine (3.1), New Hampshire (2.7), and Pennsylvania (4.4)~~. The analysis reveals geographic patterns where small states often cannot achieve proportional representation due to having only one House seat.
**Limitations:** Uses presidential vote as proxy for partisan preference rather than actual House vote totals. Assumes presidential voting reflects general partisan preference, which may not capture voters who prefer divided government or have different executive vs. legislative preferences.
**Note:** This is a corrected version addressing calculation errors identified by the community in my previous post.
This would work way better with actual data in the map clicks. All you provide is the final RAI. It fairly easy to provide the 2 key data points that make up that number – presidential percentage and house percentages.
Texas, for example, was 56% Trump / 42% Harris. The congressional reps are 66% R / 33% D.
Comments are closed.