The relative abundances of five common genera, Pseudomonas, Acinetobacter, Exiguobacterium, Sphingobacterium, Chryseobacterium in NDE of indoor stadium and corresponding SI were obtained via periodical samplings and analyses, respectively (Fig. 1).
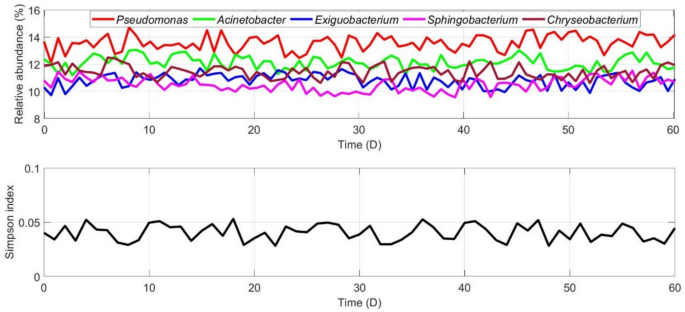
Dynamic characteristics of relative abundances of five common bacterial genera and the SI of bacterial community in NDE of indoor stadium.
As illustrated in Figs. 1, the relative abundances of Pseudomonas, Acinetobacter, Exiguobacterium, Sphingobacterium, Chryseobacterium were not significant difference in NDE of indoor stadium (F = 0.84, p > 0.05), and dominant species did not appear via statistical analyses. The SI of bacterial community demonstrated high bacterial diversity was formed and maintained in NDE of indoor stadium.
CA modeling and simulationHypotheses on bacterial community succession mechanism in NDE
Based on QS and NMII of SLI sharing in combination with microbial ecology, observed phenomena and experimental data, four fundamental hypotheses were put forward for elucidation of bacterial community succession mechanisms underlying the experimental phenomena and data in NDE of indoor stadium as follows:
(1)
Based on QS, a cell could recognize both type and number of cells occupying on the eight nearest neighboring grids in cellular space (CS). If a cell took up a grid with substrate, it might secrete ESM broadcasting SLI to other cells within a certain range, which can make cells within this range easier to find the substrate position, thus increase their survival probability. Furthermore, a cell could perceive both ESM concentration and the gradient of ESM concentration on a grid it currently occupied, the gradient of ESM concentration was defined as the ESM concentration difference between two adjacent grids.
(2)
Based on NMII, four ecological relationships might exist in the bacterial community in NDE of indoor stadium, which were intraspecific competition and cooperation, interspecific competition and cooperation. Hence, it was supposed that two types of ESM could be secreted by a cell, one was ESMe which only communicate SLI between a cell and its closed relatives, whereas nonrelative cells cannot recognize SLI information coded in ESMe, and another was ESMc, cells of all species could perceive SLI information it contained. If a cell took up a grid with substrate, the type and secretion intensity of ESM was totally dependent on the number and kind of cells on its eight nearest neighboring grids (Fig. 2).
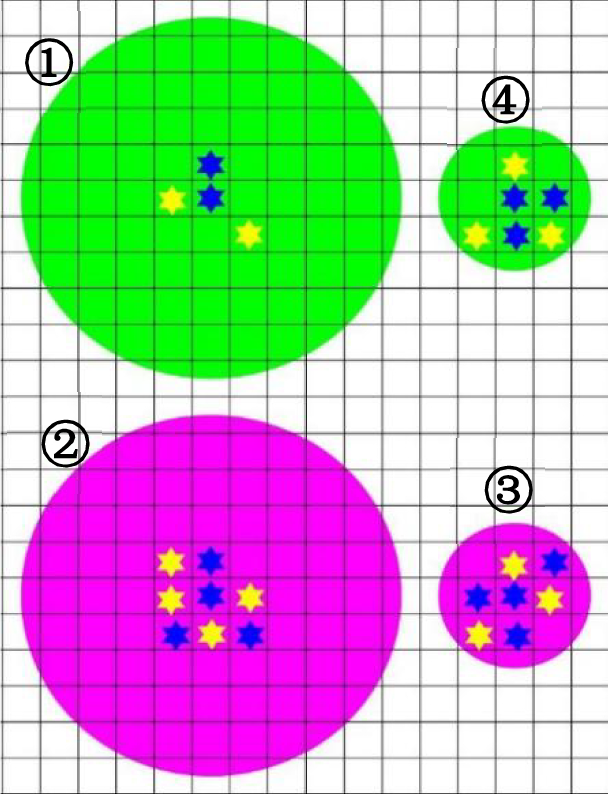
A typical situation of ESM secretion corresponding to the second hypothesis (The green and magenta color respectively stands for diffusion range of ESMc (3r–5r) and ESMe (r–2r), and r denotes cellular radius. A centrally located blue hexagon represents a cell occupying a grid with substrate, the nearest neighboring cells with blue and yellow color denote close relatives and nonrelatives, respectively.).
Scenario ①: If cell numbers were less than 4 around its eight nearest neighboring grids, a cell would secrete ESMc with high intensity to increase both intraspecific and interspecific cooperation.
Scenario ②: If cell numbers were no less than 4 around its eight nearest neighboring grids but number of close relative cells were no more than 3, it would secrete ESMe with high intensity to greatly increase both intraspecific cooperation and interspecific competition.
Scenario ③: If a cell number was no less than 6 around its nearest neighboring grids and number of close relative cells were no less than 3, it would secrete ESMe with low intensity to decrease intraspecific cooperation and increase interspecific competition.
Scenario ④: Except the scenario of ①, ②, ③, a cell occupying a grid with substrate would secrete ESMc with low intensity to increase intraspecific cooperation and decrease interspecific competition.
(3)
Only the first cell finding and occupying a grid with substrate would secrete ESM to broadcast SLI. After it dies, another cell moving or dispersing to this grid it occupied would not secrete ESM again. If a cell accepted SLI from more than one direction, it would move or disperse towards a nearest grid with substrate dependent on magnitude of ESM gradients.
(4)
The different kinds of substrate would be randomly generated and uniformly placed on CS with a fixed period, which could be considered as public goods that can be directly utilized by all bacterial species without particular preference. As the eight nearest neighboring grids of a grid with substrate have been occupied by eight cells, substrate was run out and ESM would also not be secreted.
CA modeling of bacterial community succession in NDE of indoor stadiumState space
The state space of CA including five states {S, V, N, E, K} was defined on a grid(i, j), and (i, j) ∈ Z (intset) denoted the coordinate of this grid on CS, where S was bacterial species of a cell occupying a grid (i, j), V was feature vector of a bacterial species occupying a grid (i, j), each element in V represented a normalized physiological or ecological feature of a bacterial species, N was kind of substrate placed on a grid (i, j), E was ESM (ESMc or ESMe) concentration on a grid (i, j) and K denoted whether the grid (i, j) was occupied by a cell.
CS, neighbor type and boundary conditions
①
Size of CS: 103 × 103 square grids were used to construct two-dimensional CS.
②
Neighbor type: Moore-type neighbor was applied for CA modeling and simulation.
③
Boundary conditions: In order to acquire a more general and universal spatiotemporal succession pattern of bacterial community in NDE of indoor stadium, periodic boundary signifying a boundless CS was applied for CA modeling and simulation.
Update rules
Based on above hypothesis (1) ~ (4), five update rules were formulated to drive CA evolution as follows:
①
Rule of ESM diffusion
According to hypothesis (2), the E(i, j) was calculated based on classic diffusion equation as follows:
$$\frac{\partial \mathbf{E}\left(i,j\right)}{\partial \mathbf{t}}=\sigma \nabla \mathbf{E}\left(i,j\right)$$
(1)
where σ is the diffusive coefficient of ESM without distinction between ESMc and ESMe. Obviously, the bigger σ, the larger diffusion area of ESM, and vice versa. Hence the σ can be set as σs and σw, denoting strong and weak ESM secretion by a cell, respectively. The Eq. (1) was numerically solved after Dirichlet boundary condition was specified, E0(i0, j0) was initial ESM concentration secreted by a cell occupying on a grid(i0, j0) with substrate.
②
Rule of substrate placed on a grid (i, j)
In order to simulate the dust particles containing a small amount of macromolecular organic matters in the air precipitated and scattered on the heels, joints of walls, under-seat ground and ceiling of indoor stadium, the different kinds of substrates marked with an integer number were randomly computer-generated and placed on the CS with a period of ts, and the substrate placement locations were determined by Monte Carlo simulation, the probability of substrate placing on each grid was equal.
③
Rule of substrate consumption
If the eight nearest neighboring grids of a grid (i, j) with substrate were all occupied by cells, then E (i, j) = 0, indicating that substrate on the grid (i, j) was used up.
④
Rule of cell movement and ESM secretion.
For a cell on a grid (i, j), if it did not get ESM, i.e., E (i, j) = 0, it would arbitrarily move to a nearest neighboring vacant grid with possibility of p_m at each time step until reached a grid with ESM concentration, i.e., E (i, j) ≠ 0. If a cell got ESM from more than one grid (i, j), it would move or disperse up the contours of E (i, j) to find the nearest grid with substrate.
⑤
Rule of birth and death.
According to the rule of Conway’s life game37, if a cell occupying a grid (i, j) with substrate was surrounded with more than three cells on its eight nearest neighboring grids, it would die with the probability pd_c due to intensified intra- and inter-specific competition. A cell came to death due to starvation with a probability pd_f, if it could not find a grid with substrate over a specific foraging time, tf. Furthermore, any cell would be natural death with same probability of pd_n at each time step.
Spatial pattern of bacterial community succession in NDE of indoor stadium
The S types of species with different initial number of cells (S0) were randomly generated to uniformly seed on the CS grids, a certain type of bacterial species was represented a feature vector (V) with 100 numbers which were uniformly distributed random numbers in the interval from 0 and 1, and generated by Monte Carlo experiment. If the feature vector distance of two cells was less than a specific value, these two cells could be considered as close relatives, elsewise they were distant relatives. Simultaneously, N kinds of substrate labeled from 1 to N were also computer-generated and uniformly placed on N grids in CS. Here N was far less than S to simulate NDE of indoor stadium.
Before confirmation of the proposed hypothesis on QS and NMII of SLI sharing mechanism to drive community succession with high bacterial diversity in NDE of indoor stadium, the range of parameters were taken from reference38, and put in CA model for simulation (Table 2), and these parameters’ value was totally determined by Monte Carlo experiment to simulate the actual scenarios during the process of bacterial community succession in NDE of indoor stadium.
Driven by dynamic mechanism of QS and NMII of SLI sharing, the spatial distribution and aggregation patterns of cells were emerged spontaneously along with community succession in NDE of indoor stadium (Fig. 3).
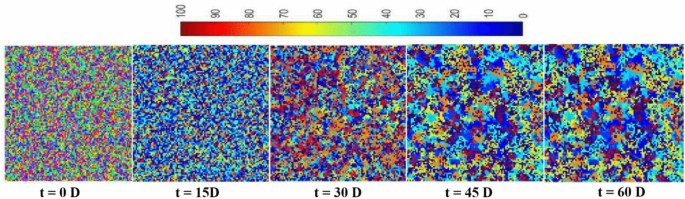
Spatial pattern of bacterial community succession in NDE of indoor stadium (color represents the cell number of species).
As a control, the scenario of QS without NMII of SLI sharing (the equivalent of kin selection) was also investigated, the SLI was only shared among cells of close relatives through only secretion of ESMe, thus they could quickly find the substrate location for growth and reproduction, whereas cells of nonrelative species could not receive SLI to decrease survival possibility. The spatial distribution and aggregation pattern of cells were investigated under the scenario of QS with (Fig. 4A) and without NMII (Fig. 4B) of SLI sharing, respectively.
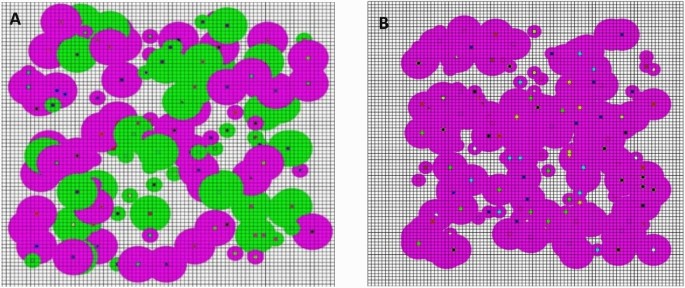
ESM secretion with (A) and without (B) NMII of SLI sharing along with cells occupying the grids with substrate in CS.
The clustering analysis, equivalently phylogenetic analysis, was conducted to analyze genetic relationship and species diversity. Twenty patches were randomly and uniformly sampled on CS after community succession stabilization in scenario of QS with and without NMII of SLI sharing, respectively. In order to create a most precise cluster tree with desired hierarchical construction to explain genetic relationship of cells and elucidate the forming and sustenance mechanism of bacterial diversity in NDE of indoor stadium, the Euclidean distance, squared Euclidean distance, standardized Euclidean distance, Mahalanobis distance, Cityblock distance, Minkowski distance, Chebychev distance and Hamming distance were respectively used to measure the distance between two cells’ feature vectors (i.e., leaves distance), and unweighted average distance, centroid distance, farthest distance, weighted center of mass distance, shortest distance, inner squared distance and weighted average distance were respectively used to measure the distance between two cells’ feature vector sets (i.e., branches distance). Ultimately, the Chebychev distance and centroid distance were selected to measure the distance between leaves and between branches, respectively, since the cophenetic correlation coefficient reached maximum of 0.98, signifying the clustering solution obtained by means of combination of the Chebychev distance and centroid distance accurately reflected feature vector data the most39. Based on expert scoring results, if Chebychev distance between two cells was no more than 0.35, they were considered as close relative, otherwise nonrelative. The cluster tree and boxplot of Chebychev distances manifested that the most of nonrelative cells gathered in patches caused by NMII of SLI sharing mechanisms taking both intra- and inter-specific competition and cooperation into consideration. The cluster analysis results were illustrated in Fig. 5 where Fig. 5A and Fig. 5C showed the result of bacterial community succession driven by QS with and without NMII of SLI sharing, respectively. The MS_X stood for a cell of bacterial species numbered with an integer number, and the cluster tree reflected the evolutionary relationships between cells of different bacterial species. The cluster tree was created by Chebychev distance of leaves and centroid distance of branches. The Fig. 5B were boxplots showing the median of Chebychev distances between cells of different species in the case of QS with NMII of SLI sharing were significantly larger than scenario of QS without NMII of SLI sharing.
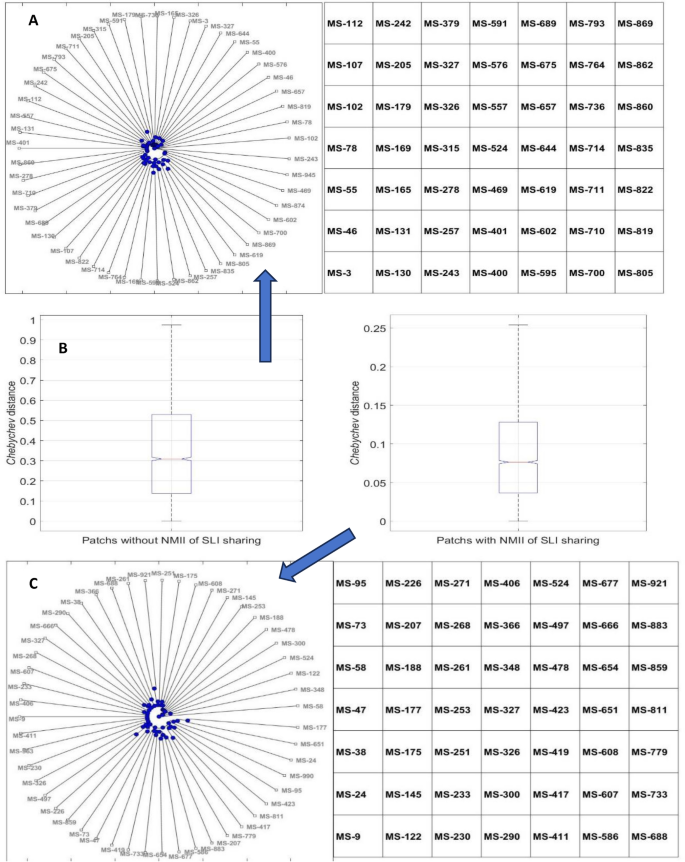
Cluster trees and cells distribution and aggregation on a typical patch in CS.
From Fig. 5A&B, it indicated different bacterial species stably coexisted in climax community, the primary cause was any one cell could find a grid with substrate with relatively short time and distance in the case of QS with NMII of SLI sharing, which undoubtedly increased the survival possibility of all bacterial species to form and maintain bacterial diversity in NDE of indoor stadium. Nevertheless, since SLI was only shared with close relatives, the most of cells with close relatives aggregated in patches formed by kin selection without NMII of SLI sharing mechanism (Fig. 5B&C), indicating the interspecific competitive exclusion decreased the survival possibility of nonrelative bacterial species due to more foraging time and distance needed to be spent by them, which definitely would prevent formation and sustenance of bacterial diversity in NDE of indoor stadium.
Temporal dynamic characteristics of bacterial community succession in NDE of indoor stadium
Driven by QS with and without NMII of SLI sharing, respectively, the temporal dynamic characteristics of bacterial community succession in NDE of indoor stadium was also obtained through accumulation of all cells of the same species on different grids at the same time. Since large quantity of species coexisted in bacterial community, here only the top twenty species populations were illustrated in Fig. 6, and they could sufficiently represent dynamic response characteristics of all species populations.
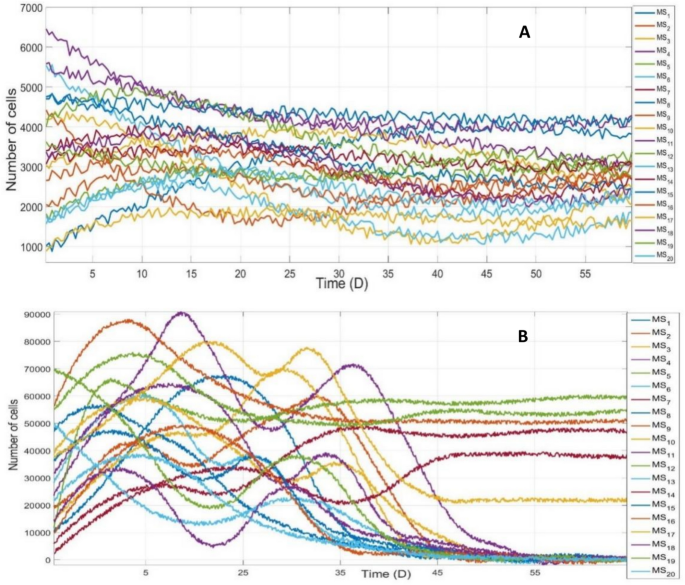
Temporal pattern of bacterial community succession driven by QS with (A) and without NMII of SLI sharing (B).
From Fig. 6A, the temporal response characteristics demonstrated that most of bacterial species’ population coexisted via transient responses to QS with NMII of SLI sharing, the number of coexisting species was far beyond provided substrate types (Table 2) in the climax community with high richness and evenness, according to Shannon index of biodiversity, namely high bacterial diversity. From Fig. 6B, however, the most of species became minority species with small population or went distinct eventually due to interspecific competitive exclusion by the few dominant species generated by QS without NMII of SLI sharing, and bacterial diversity could not be formed and maintained in NDE of indoor stadium at all. Therefore, bacterial community succession driven by QS with NMII of SLI sharing mechanism could effectively prevent any bacterial species from being dominant and eventually form and maintain a climax community with high species diversity in NDE of indoor stadium.