![[OC] Average of 256 hand-drawn copies of the Mona Lisa](https://www.europesays.com/wp-content/uploads/2025/08/f7qyox176sjf1-1080x1024.png)
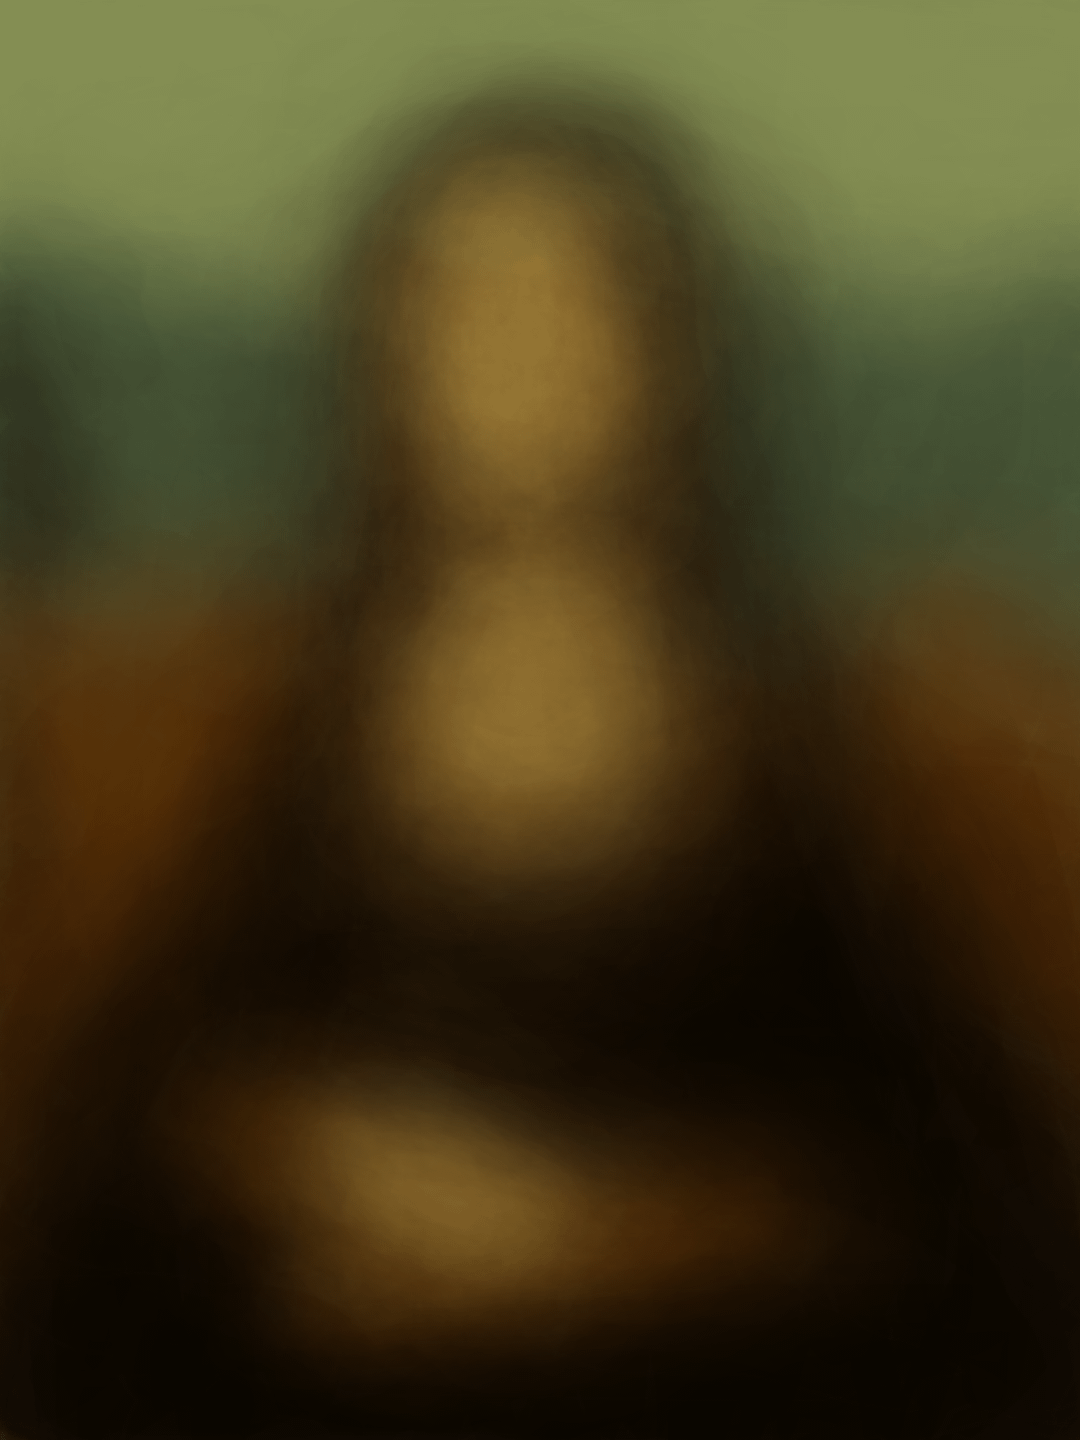
Over the past few years I’ve been working on a game about copying famous paintings as quickly and as accurately possible with a mouse. While showing prototypes at exhibitions, I saved PNGs of the "forgeries" produced.
I realized that taking the average of the forgeries made of a given painting could be cool—similar to Jason Salavon’s aggregated portraits (whose work I love). I love the ghostly/historical feel of these types of images.
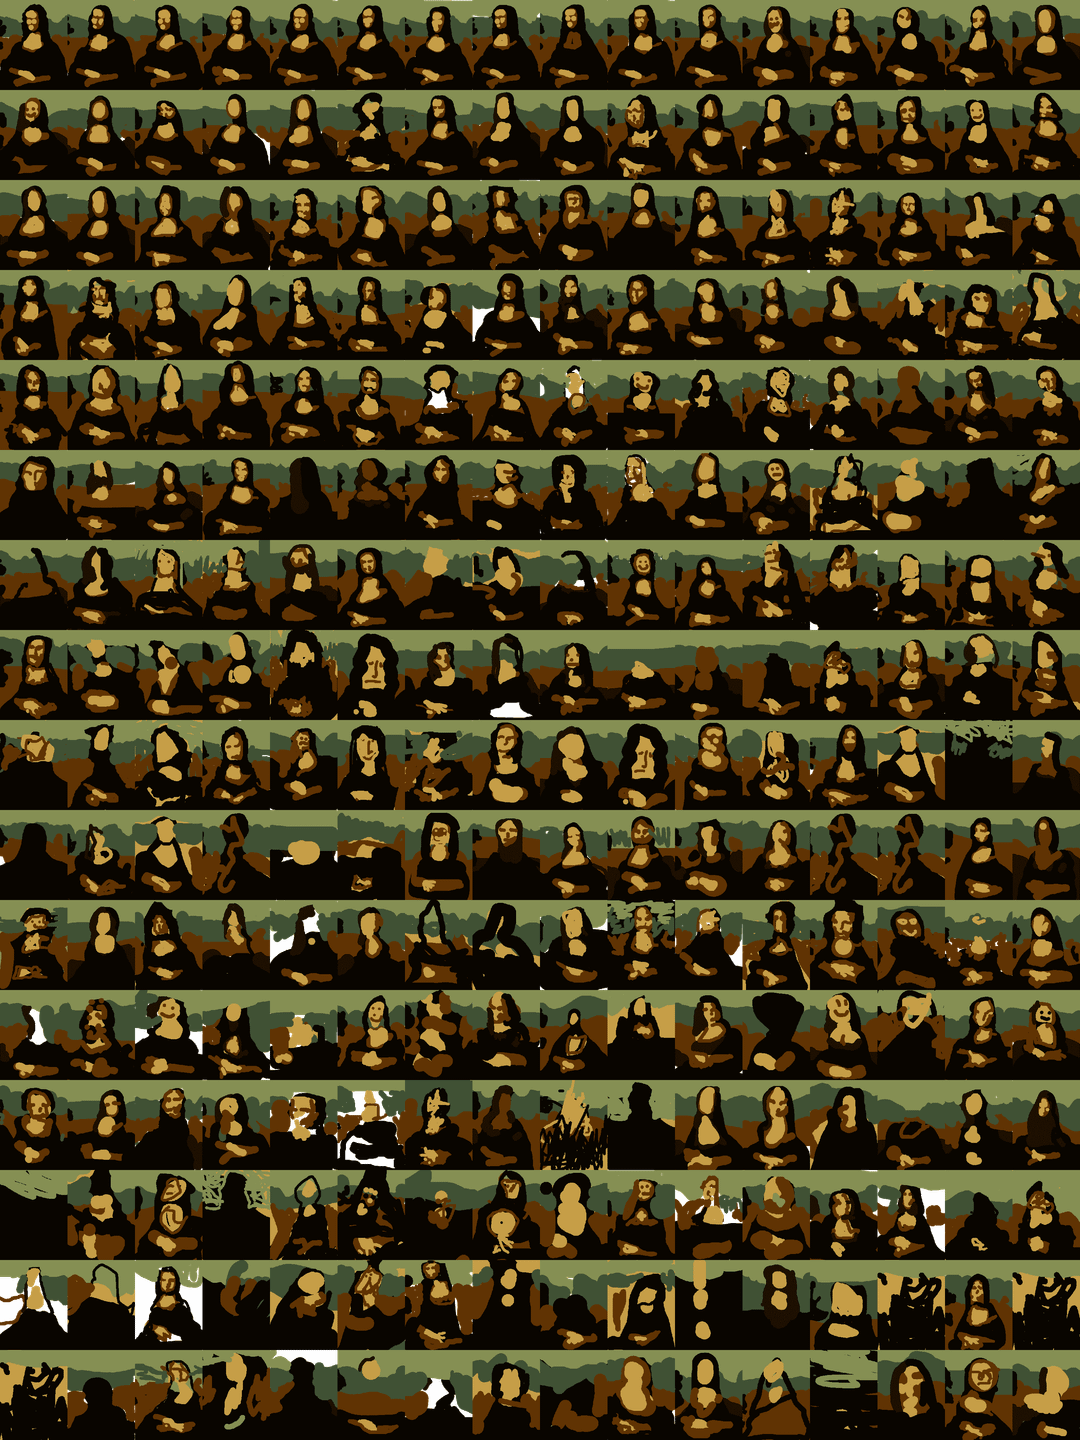
I've also posted an image that includes miniatures of the 256 Mona Lisa forgeries averaged in order of accuracy (i.e., highest scoring at the top left, lowest in the bottom-right). I’ve just started saving brush stroke data too, so I can make time-lapse replays of paintings being made.
I’d love feedback on two things:
-
Other visualization ideas I should try? I did a sliding-window average that turned out very cool. Aggregating stroke data?
-
Other types of data I should capture for future data viz or studies? I'd need to implement it soon since it's release is coming in the next few months.
Thanks in advance!
I can share a link to the game in the comments for those curious / if it helps with feedback.
Posted by playfulsystems
12 comments
What if you take out the most extreme outliers?
Sorry, I can’t help with the feedback you asked. But holy shit this is amazing. Great work!
I very rarely have any use for AI, but now I want to see what AI thinks the average of these 256 drawings is.
Do you have timing data? Could visualise the average after N seconds, and bucket the final pictures by time.
Thought these were from memory at first, would be cool to see this same experiment from memory, like is collective memory better than individual?
For those curious, these forgeries come from my game Sloppy Forgeries. Here’s the Steam page:
[https://store.steampowered.com/app/3030560/Sloppy_Forgeries/](https://store.steampowered.com/app/3030560/Sloppy_Forgeries/)
A wishlist helps a lot ❤️
Firstly, I’m looking at the output as a group prediction of what the Mona Lisa actually looks like, from individual experiences with the Mona Lisa. In that vein, I wonder if it wouldn’t be interesting to capture data for almost anything we know to be observable by multiple people to see if the group prediction matches real data describing the actual object.
Feels kinda silly typing that, but it may give someone insight into how we might layer individual sensory experiences to create an accurate portrayal of what we perceive as a group to be real or how we as a group perceive the world around us.
Are you capturing (or able to capture) the entire drawing session?
If so, you could overlay these recordings – I’d love to see the aggregate image “emerge” from a blank background.
There’s nothing informative about seeing that, I just think it could look interesting to see multiple disconnected painting approaches slowly converging into the same basic composition.
This might not work great with 256 overlapping sessions, but if you took 5-10 that represent even increments from the least accurate to the most accurate, the final image would still look pretty close to the aggregate image you posted here.
How are you creating the average? The first method I thought of was to average the RGB values for each pixel, but would that create a grey mess if there were a lot of different colors in the average for a particular pixel?
That’s honestly super cool. How does the averaged painting score on the similarity score you mentioned using for the selected sample?
Reminds me of that Black mirror episode, where a young data analyst that works for the police, goes to interview multiple witnesses and record their memory of a certain incident. Even though a single recording isn’t reliable (because the brain itself is unreliable), averaging the memories of multiple witnesses allows her to get closer and closer to the objective reality.
As there’s only a few colour options, I’d be interested to see how the average would look like if you used the median colour for each pixel – could be quite accurate to the real thing!
Comments are closed.