Significant Shift in the Distillate Market
Geopolitical shocks had dramatic effects on the ULSD future curve
Backwardation can be costly to holders of physical inventory
Recent price action has opened a window of opportunity
U.S. natural gas spare capacity may affect future supply growth
Sincerely,
David Thompson, CMT
Executive Vice President
Powerhouse
(202) 333-5380
The Matrix
Between mid-June and mid-July, the oil markets experienced two major price spikes – around the Israel/Iran War and the initial announcement of possible secondary tariffs on buyers of Russian petroleum. Of particular note to our readers is the effect these price spikes had on the ULSD futures curve.
Bullish price shocks typically impact the futures curve in the form of an expansion of the spread between the front-month contract and more deferred contract months. The chart below shows the first 36 months of the ULSD futures curve on June 13 (in black), July 14 (in red) and August 15 (in blue). Not only did the absolute price level rise during these events, the futures curve became much steeper. Significant price backwardation developed.
For companies holding physical diesel inventory and hedging those gallons with the NYMEX futures contract, severe backwardation is an unwanted dynamic. At month-end, distributors and jobbers need to roll their protective hedges and are forced to do so at a lower level due to the position of the curve.
Since mid-July however, the ULSD price has fallen, and the blue August 15 futures curve shows a noticeable reduction in backwardation. The green oval on the left-hand side of graph highlights that the December and January futures contract prices are nearly equal. This may be an opportunity for diesel inventory holders to pre-roll protective hedges at or near parity and sidestep the adverse effects of backwardation.
Please reach out to us if you would like to discuss this strategy in more detail.
Supply/Demand Balances
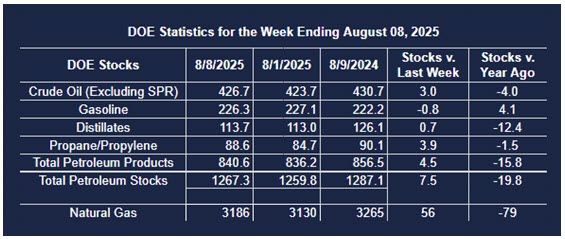
Supply/demand data in the United States for the week ending August 8, 2025, were released by the Energy Information Administration.
Total commercial stocks of petroleum increased (⬆) 7.7 million barrels to 1.2673 billion barrels during the week ending August 8, 2025.
Commercial crude oil supplies in the United States were higher (⬆) by 3.0 million barrels from the previous report week to 426.7 million barrels.
Crude oil inventory changes by PAD District:
PADD 1: Up (⬆) 0.1 million barrels to 8.6 million barrels
PADD 2: Down (⬇) 1.5 million barrels to 102.4 million barrels
PADD 3: Up (⬆) 6.2 million barrels to 248.4 million barrels
PADD 4: Unchanged (=) at 22.8 million barrels
PADD 5: Down (⬇) 1.9 million barrels 44.4 million barrels
Cushing, Oklahoma, inventories were up (⬆) 0.1 million barrels to 23.1 million barrels.
Domestic crude oil production increased (⬆) 43,000 barrels per day from the previous report at 13.327 million barrels per day.
Crude oil imports averaged 6.920 million barrels per day, a daily increase (⬆) of 958,000 barrels. Exports increased (⬆) 259,000 barrels daily to 3.577 million barrels per day.
Refineries used 96.4 percent of capacity; a decrease (⬇) of 0.5 percent from the previous report week.
Crude oil inputs to refineries increased (⬆) 56,000 barrels daily; there were 17.180 million barrels per day of crude oil run to facilities. Gross inputs, which include blending stocks, decreased (⬇) 16,000 barrels daily to 17.506 million barrels daily.
Total petroleum product inventories increased (⬆) by 4.5 million barrels from the previous report week, up to 840.6 million barrels.
Total product demand increased (⬆) 1,235,000 barrels daily to 21.357 million barrels per day.
Gasoline stocks decreased (⬇) 0.8 million barrels from the previous report week; total stocks are 226.3 million barrels.
Demand for gasoline decreased (⬇) 40,000 barrels per day to 9.000 million barrels per day.
Distillate fuel oil stocks increased (⬆) 0.7 million barrels from the previous report week; distillate stocks are at 113.7 million barrels. EIA reported national distillate demand at 3.701 million barrels per day during the report week, a decrease (⬇) of 20,000 barrels daily.
Propane stocks rose (⬆) 3.9 million barrels from the previous report to 88.6 million barrels. The report estimated current demand at 717,000 barrels per day, a decrease (⬇) of 88,000 barrels daily from the previous report week.
Natural Gas
Prompt natural gas futures prices have dropped back below the $3 level as early season hot weather has moderated (on a year over year basis) and producers have continued to add to supply. However, U.S.-based natural gas “space capacity” in the form of remaining DTILs and DUCs has dropped. DTILs (deferred turned in-line) are in
effect a form of storage. They require approximately one month to begin producing. According to some analysts, this may limit further supply growth in the second half of 2025.
According to the EIA:
Net injections into storage totaled 56 Bcf for the week ending August 8, compared with the five-year (2020–24) average net injections of 33 Bcf and last year’s net withdrawals of 2 Bcf during the same week. Working natural gas stocks totaled 3,186 Bcf, which is 196 Bcf (7%) more than the five-year average and 79 Bcf (2%) lower than last year at this time.
According to The Desk survey of natural gas analysts, estimates of the weekly net change to working natural gas stocks ranged from net injections of 46 Bcf to 66 Bcf, with a median estimate of 56 Bcf.
The average rate of injections into storage is 23% higher than the five-year average so far in the refill season (April through October). If the rate of injections into storage matched the five-year average of 9.1 Bcf/d for the remainder of the refill season, the total inventory would be 3,949 Bcf on October 31, which is 196 Bcf higher than the five-year average of 3,753 Bcf for that time of year.
Was this helpful? We’d like your feedback.
Please respond to [email protected]
This material has been prepared by a sales or trading employee or agent of Powerhouse Brokers, LLC and is, or is in the nature of, a solicitation. This material is not a research report prepared by Powerhouse Brokers, LLC. By accepting this communication, you agree that you are an experienced user of the futures markets, capable of making independent trading decisions, and agree that you are not, and will not, rely solely on this communication in making trading decisions.
DISTRIBUTION IN SOME JURISDICTIONS MAY BE PROHIBITED OR RESTRICTED BY LAW. PERSONS IN POSSESSION OF THIS COMMUNICATION INDIRECTLY SHOULD INFORM THEMSELVES ABOUT AND OBSERVE ANY SUCH PROHIBITION OR RESTRICTIONS. TO THE EXTENT THAT YOU HAVE RECEIVED THIS COMMUNICATION INDIRECTLY AND SOLICITATIONS ARE PROHIBITED IN YOUR JURISDICTION WITHOUT REGISTRATION, THE MARKET COMMENTARY IN THIS COMMUNICATION SHOULD NOT BE CONSIDERED A SOLICITATION.
The risk of loss in trading futures and/or options is substantial and each investor and/or trader must consider whether this is a suitable investment. Past performance, whether actual or indicated by simulated historical tests of strategies, is not indicative of future results. Trading advice is based on information taken from trades and statistical services and other sources that Powerhouse Brokers, LLC believes are reliable. We do not guarantee that such information is accurate or complete and it should not be relied upon as such. Trading advice reflects our good faith judgment at a specific time and is subject to change without notice. There is no guarantee that the advice we give will result in profitable trades.
Copyright 2025 Powerhouse Brokers, LLC, All rights reserved