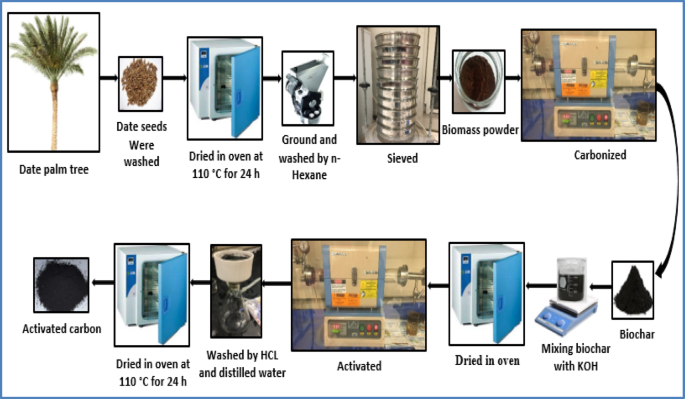
The initial step in preparing the adsorbent involved synthesizing biochar from date seeds via pyrolysis. The selection of pyrolysis conditions was guided by established literature, which typically reports temperatures between 300 and 700 °C and durations of 1–3 h to ensure complete carbonization while balancing yield and energy efficiency42,44,60. Accordingly, we chose representative temperatures of 400 °C and 500 °C and durations of 1.5 and 2 h to conduct preliminary experiments aimed at producing a suitable precursor for chemical activation.
The residence times of 1.5 and 2 h were selected as they lie well within the typical range of 1–3 h commonly reported in the literature for ensuring complete carbonization of biomass precursors44,61,62. These durations offer an effective compromise between promoting sufficient thermal decomposition and maximizing carbon yield, while avoiding excessive energy consumption associated with prolonged treatment. For instance, Hameed et al.44 also used a 2-h carbonization period for date seeds, whereas other studies have reported successful carbonization at 1 h 161 and 1.5 h38, supporting the suitability of the durations used in this study.
As detailed in Table 1, these conditions confirmed a clear trade-off between biochar yield and initial surface area development. Pyrolysis at a higher temperature (500 °C) produced a lower yield (27.50%) but resulted in a more developed pore structure, evidenced by a greater BET surface area (10.25 m²/g). In contrast, pyrolysis at 400 °C yielded more biochar (up to 34.18%) but with a substantially less developed surface.
Based on these results, the biochar prepared at 500 °C for 2 h was selected as the optimal precursor for subsequent activation, as its higher initial surface area provided a better foundation for enhancement. It is important to note that this surface area of 10.25 m²/g, while low for an activated carbon, is entirely consistent for a non-activated biochar. For comparison, Bouchelta et al.63 reported a surface area of only 4.8 m²/g for date stone biochar carbonized at a high temperature of 800 °C, while Kalderis et al.64 found a value of 13.6 m²/g for rice husk biochar prepared at 400 °C. Our choice of a 500 °C pyrolysis temperature is also in agreement with other studies that have used this condition to prepare biochar for high-surface-area activated carbons61,62,65.
This selected biochar was then chemically activated with potassium hydroxide (KOH) to significantly increase its porosity and adsorption capacity. Table 2 presents the results of these activation experiments, which were conducted at 700 °C for 2 h using varying KOH-to-biochar impregnation ratios (from 0.5:1 to 5:1).
The results demonstrate a clear trend: as the KOH impregnation ratio increases, the BET surface area increases significantly—from 529.16 m²/g at a 0.5:1 ratio to 2417.54 m²/g at a 5:1 ratio—indicating enhanced pore development due to more aggressive activation. However, this comes at the expense of yield, which decreases from 21.31% (AC1) to 13.75% (AC6). This inverse relationship suggests that higher KOH ratios promote gasification and carbon burn-off, reducing yield but increasing porosity. The 4:1 ratio (AC5) offers a favorable balance, achieving a high surface area (2151.31 m²/g) and a moderate yield (15.43%), with a productivity index (Yield × BET) of 331.95 m²/g of biochar.
To further optimize the activation process, the 4:1 KOH impregnation ratio was held constant while activation temperature and time were varied. Table 3 summarizes the effect of these parameters on BET surface area and yield. The data in Table 3 reveal that higher activation temperatures (700 °C) produce significantly higher BET surface areas compared to lower temperatures (500 °C), confirming that elevated temperatures enhance pore formation. At 700 °C, variations in heating time (1–3 h) have a marginal impact on surface area, although extended heating slightly reduces yield due to additional carbon loss. The surface area declines modestly from 2151.31 m²/g (AC5, 2 h) to 2072.98 m²/g (AC8, 1 h) and 2128.99 m²/g (AC7, 3 h), while yield decreases more noticeably from 15.43 to 14.27%. These findings suggest that activation at 700 °C for 2 h offers the best compromise between surface area and material recovery.
Table 4 compares the surface area, pore volume, and pore size of biochar and activated carbon samples. The data indicate a drastic transformation from macroporous biochar (pore size ~ 50 nm) to microporous and mesoporous activated carbons with much higher surface areas and smaller pore sizes (~ 2–4 nm). These results confirm that increasing the KOH ratio and activation temperature enhances both surface area and pore volume, while reducing pore size. The AC6 sample, produced at a 5:1 KOH ratio, exhibits the highest BET surface area and pore volume, although with the lowest yield.
FTIR spectroscopy analysis
FTIR spectroscopy was employed to identify the surface functional groups present in the precursor material and the activated carbon. Figure 5 shows the FTIR spectrum of the raw precursor (date palm seed). A broad, intense band observed at 3422 cm⁻¹ is attributed to O–H stretching vibrations, characteristic of hydroxyl groups in alcohols and phenols, and indicative of moisture and lignocellulosic components. Peaks at 2924 cm⁻¹ and 2855 cm⁻¹ correspond to C–H stretching vibrations of aliphatic –CH₂ and –CH₃ groups, commonly found in alkanes. A sharp peak at 1653 cm⁻¹ is assigned to C = O stretching, suggesting the presence of ketones or conjugated carbonyl compounds. Peaks at 1436 cm⁻¹ and 1375 cm⁻¹ are associated with C–C stretching in aromatic rings, while the band at 1036 cm⁻¹ may correspond to C–H bending in alkanes or vibrations of alkyl halides. Additional peaks at 870 cm⁻¹ and 806 cm⁻¹ suggest C–O bonding in alcohols, carboxylic acids, or esters66. Collectively, these bands reflect the presence of various functional groups typical of lignocellulosic biomass composed of cellulose, hemicellulose, and lignin.
After KOH activation, the FTIR spectrum of sample AC5 (Fig. 6) exhibits distinct changes. The broad O–H band remains at 3420 cm⁻¹, indicating the persistence of hydroxyl-containing groups. Peaks at 2924 cm⁻¹ and 2855 cm⁻¹ are still observed and correspond to C–H stretching vibrations in alkanes66. New bands at 2375 cm⁻¹ and 2310 cm⁻¹ are attributed to C ≡ N stretching vibrations, potentially arising from nitrile groups or physically adsorbed CO₂.
The peak at 1705 cm⁻¹ is associated with C = O stretching in carbonyl-containing groups such as ketones, aldehydes, or carboxylic acids67. A distinct band at 1569 cm⁻¹ suggests the presence of C = C stretching within aromatic rings. The band at 1033 cm⁻¹ is assigned to C–O stretching vibrations typical of alcohols and carboxylic acids68. Additionally, a band at 750 cm⁻¹ corresponds to C–H out-of-plane bending, while a low-intensity peak at 475 cm⁻¹ is attributed to C–X stretching, characteristic of alkyl halides67.
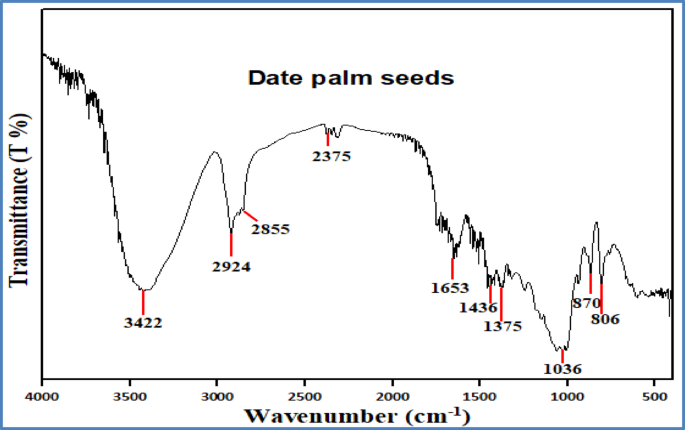
FTIR spectra for date palm seeds.
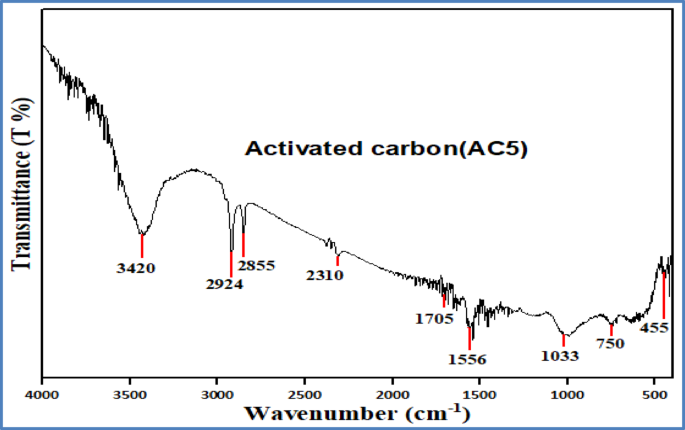
FTIR spectra for activated carbon (AC5).
SEM analysis
The three SEM images illustrate the morphological evolution of date seeds through different processing stages. In Fig. 7a, the raw date seeds display a dense, uneven, and rough surface with no visible pores, indicative of their natural, untreated structure. After carbonization, as shown in Fig. 7b, some pores begin to emerge as the cell structure partially decomposes, creating initial pathways that modestly increase the surface area. Finally, Fig. 7c depicts the effect of potassium hydroxide activation, resulting in a well-defined porous structure with a more uniform surface. This activation process significantly enhances pore formation and surface uniformity, creating an interconnected network of pores that improves the material’s adsorptive capacity, making it more suitable for applications requiring high surface area and porosity.
The surface of the KOH-activated carbon reveals a well-developed porous network with numerous cavities. These are formed during activation as the impregnated KOH etches the carbon framework, leaving behind an interconnected system of voids upon its removal during the washing stage. These cavities form channels that facilitate the movement of adsorbate molecules through the interconnected micro- and mesopores within the carbon structure, enhancing the material’s ability to capture and hold adsorbed substances effectively66.
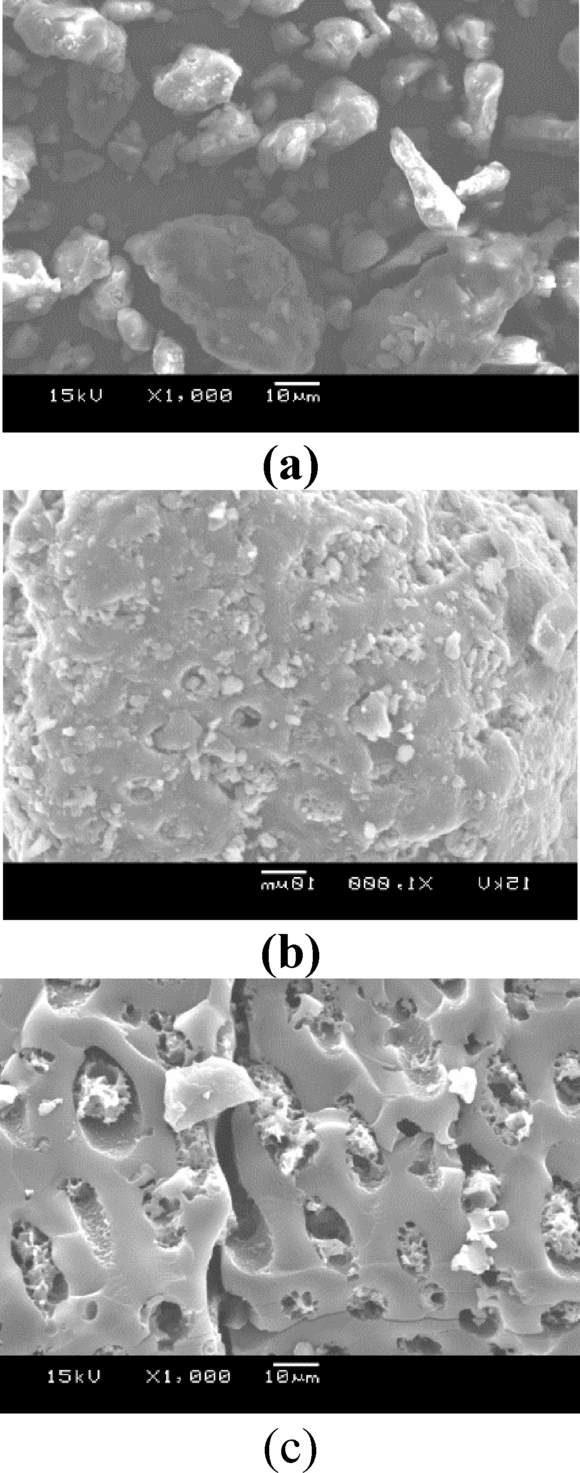
SEM images at 1000× magnification for the following samples: (a) raw date palm seed, (b) biochar, and (c) activated carbon (AC5).
Effects of adsorption parametersEffect of BET surface area and adsorbent dosage
Four chemically activated carbon samples with varying BET surface areas—AC3 (1328.61 m²/g), AC4 (1772.70 m²/g), AC5 (2151.31 m²/g), and AC6 (2417.54 m²/g)—were evaluated for their crude oil adsorption performance. The quantity of crude oil adsorbed onto the activated carbon at equilibrium, \(\:{q}_{e}\)(mg/g), and the percentage removal efficiency were calculated using Eqs. (2) and (3). The adsorption performance at an initial oil concentration of 1000 mg/L, 1-h contact time, temperature of (30 ± 2 °C), and dosages ranging from 0.01 to 0.2 g (in 40 mL solution) are illustrated in Figs. 8, 9, 10 and 11 for AC3, AC4, AC5, and AC6, respectively.
Two opposing trends were observed in these figures. The removal efficiency (right-hand axis) increases sharply with dosage before approaching an asymptotic value. The rise in removal efficiency occurs because a greater mass of adsorbent introduces more total active sites into the solution, allowing for the capture of more oil molecules. The curve flattens as the system approaches its maximum achievable removal, at which point the concentration of remaining oil becomes the limiting factor, and adding more adsorbent yields only marginal gains.
In contrast, the adsorption capacity, \(\:{q}_{e}\) (left-hand axis), which measures the mass of oil adsorbed per gram of carbon, is highest at the lowest dosages and decreases as more adsorbent is added. This is because at low dosages, the abundance of oil molecules relative to the available active sites ensures that the adsorbent surface is used very efficiently. As the dosage increases, the number of active sites begins to far exceed the number of oil molecules, leading to a larger fraction of unsaturated sites. This inefficient utilization of the surface area causes the efficiency per unit mass (\(\:{q}_{e}\)) to drop. The curve becomes asymptotic as the system reaches a state where the ratio of adsorbate to adsorbent sites stabilizes. These trends have also been reported in earlier studies69, further validating the observed adsorption behavior.
Among the tested adsorbents, AC5 consistently exhibited the best overall performance, demonstrating a superior balance of high adsorption capacity and high removal efficiency across the entire dosage range. The overall performance of the activated carbons followed the order: AC5 > AC3 > AC6 > AC4.
A key finding of this study is that the highest BET surface area did not correspond to the best adsorption performance for crude oil. Although AC6 possessed the largest surface area (2417 m²/g), it was significantly outperformed by AC5 (2151 m²/g), which exhibited the highest adsorption capacity (1816 mg/g). This result strongly suggests that for a complex mixture like crude oil, surface chemistry plays a role as critical as, or even more critical than, total surface area.
The superior performance of AC5 can be attributed to its optimized surface functionality, as revealed by the FTIR analysis (Fig. 6). The spectrum for AC5 shows a well-defined combination of polar functional groups (such as hydroxyl, carbonyl, and carboxylic acid groups) and nonpolar moieties (aliphatic and aromatic structures). This chemical heterogeneity likely creates a multifunctional surface uniquely suited for adsorbing the diverse range of compounds found in crude oil through multiple mechanisms, including hydrophobic interactions, π–π stacking with aromatic rings, and polar interactions. In contrast, the more aggressive activation that produced AC6’s higher surface area may have altered these crucial functional groups, potentially leading to a surface less favorable for effective crude oil binding.
AC5 displayed the highest adsorption capacity, reaching 1816 mg/g at 0.01 g, indicating strong affinity and capacity for crude oil adsorption. AC3 followed, with a peak adsorption capacity of 1155.32 mg/g at the same dosage, while AC6 achieved a maximum adsorption capacity of 1001.62 mg/g at 0.01 g. In contrast, AC4 demonstrated the lowest maximum adsorption capacity, reaching 859.39 mg/g at 0.01 g. In terms of removal efficiency, AC5 consistently performed well, reaching 80.5% at a dosage of 0.2 g. While AC3 achieved a slightly higher final removal efficiency (87.1% at 0.2 g), its performance is overshadowed by the exceptional adsorption capacity (\(\:{q}_{e}\)) of AC5. As shown in the figures, AC5’s capacity of 1816 mg/g at low dosages is significantly greater than that of AC3 (1155 mg/g), indicating a much more efficient adsorbent on a per-mass basis. Therefore, considering both its high capacity and high removal efficiency, AC5 was identified as the superior material overall. AC6 reached a removal efficiency of 66.4% at 0.15 g, while AC4 exhibited the lowest removal efficiency, peaking at 63.6% at 0.2 g, making it the least effective adsorbent overall in terms of both adsorption capacity and removal efficiency.
The superior performance of AC5, with a maximum adsorption capacity of 1816 mg/g, is particularly noteworthy when compared to the existing literature. A recent and highly relevant study by Alsulaili et al.46 also investigated activated carbon derived from the same Khalas date seed variety for the removal of emulsified oil. Through their optimization process, they reported a maximum adsorption capacity of 191 mg/g. The substantially higher capacity—nearly an order of magnitude greater—achieved in our study highlights the critical impact of our systematic optimization of the KOH impregnation ratio and activation conditions. This comparison confirms that while the choice of precursor is important, the synthesis pathway is paramount in developing a high-performance adsorbent for oil remediation.
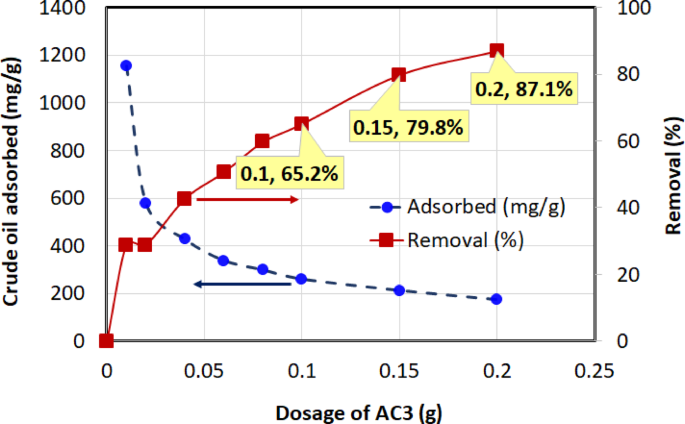
Effect of AC3 dosages on crude oil adsorption and removal efficiency.
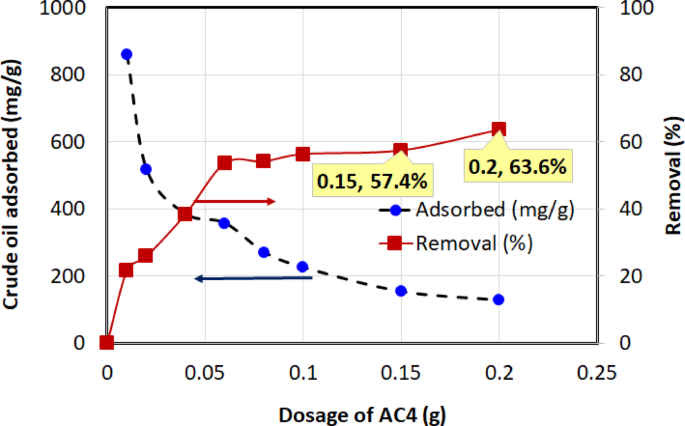
Effect of different AC4 dosages on crude oil adsorption and removal efficiency.
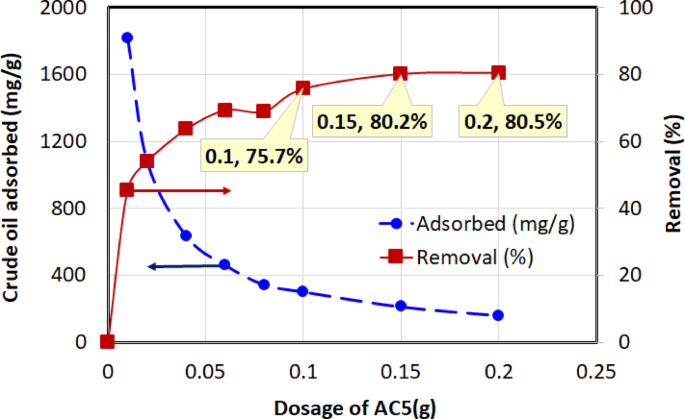
Effect of different AC5 dosages on crude oil adsorption and removal efficiency.
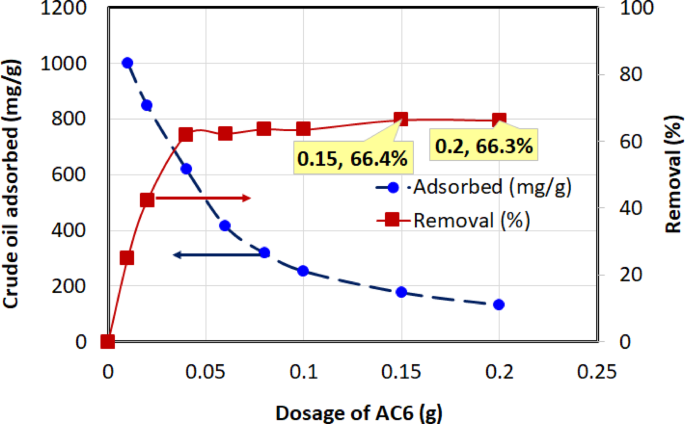
Effect of different AC6 dosages on crude oil adsorption and removal efficiency.
Effect of initial concentration
The effect of initial crude oil concentration on the adsorption capacity (\(\:{q}_{e}\)) and removal efficiency of AC5 is shown in Fig. 12. Experiments were conducted using 0.05 g of AC5 in a 40 mL solution, with initial crude oil concentrations ranging from 100 to 1000 mg/L at a temperature of (30 ± 2 °C) and a contact time of 1 h. As the initial crude oil concentration increased, the adsorption capacity (\(\:{q}_{e}\)) of AC5 also increased, reaching a maximum of 502.98 mg/g at a concentration of 1000 mg/L. This trend suggests that higher initial concentrations provide a greater driving force for mass transfer between the aqueous phase and the adsorbent surface, thus enhancing the adsorption process. However, the removal efficiency showed a different pattern. The highest removal efficiency was achieved at the lowest initial concentration of 100 mg/L, with a value of 99.5%. As the initial concentration increased, the removal efficiency decreased, dropping to 63% at 1000 mg/L. This reduction in removal efficiency with increasing initial concentration is likely due to the saturation of available adsorption sites on the AC5 surface, leading to lower percentages of crude oil being adsorbed relative to the total amount present in the solution.
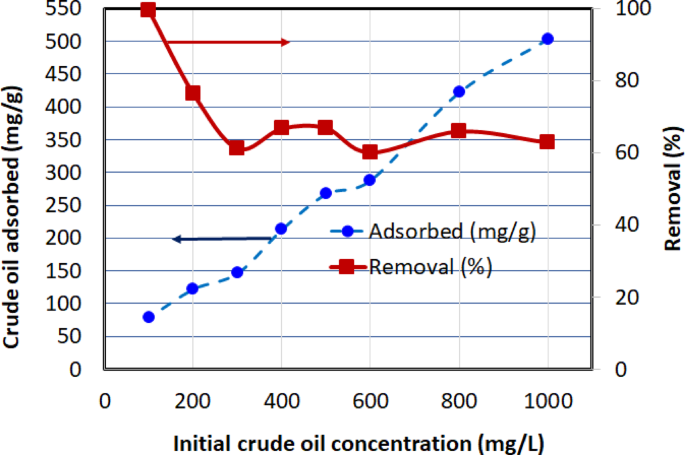
Influence of initial crude oil concentration on the efficacy of AC5 (Adsorbent Dosage = 0.05 g in 40 mL solution).
Effect of contact time
The adsorption performance of AC5 was studied over varying contact times (1, 2, 4, 8, 15 min) using 0.1 g of AC5 in a 40 mL solution of 1000 mg/L crude oil at a temperature of (30 ± 2 °C). As shown in Fig. 13, the adsorption capacity and removal efficiency initially increase with contact time, indicating that more crude oil molecules are being adsorbed onto the active sites of the adsorbent. At 1 min, the adsorption capacity was 265.94 mg/g, with a removal efficiency of 66.5%. This performance improved steadily with time, reaching \(\:{q}_{e}\) value of 320.70 mg/g at 15 min. The corresponding removal efficiency was 80.2%. The results indicate that the adsorption capacity peaked at 15 min, suggesting that equilibrium was approached, as no significant further improvement was observed beyond this time point.
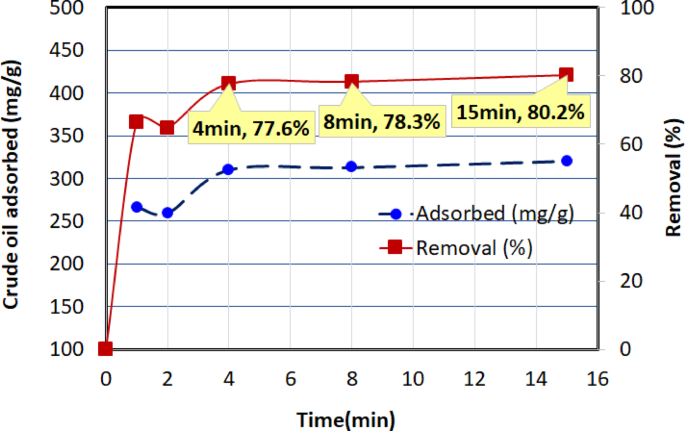
Influence of contact time on crude oil adsorption onto AC5 (Adsorbent Dosage = 0.1 g in 40 mL solution, Co = 1000 mg/L).
Isotherm model fits
Figure 14 shows the experimental data fitted to the Langmuir isotherm, where \(\:1/{q}_{e}\) is plotted against \(\:1/{C}_{e}\) as described in Eq. (6). The coefficient of determination (\(\:{R}^{2}\)) measures the goodness of fit between the observed and predicted values, with an ideal value of 1 indicating a perfect fit. Here, the \(\:{R}^{2}\) value of 0.934 suggests that the Langmuir model provides a reasonably good representation of the batch equilibrium data. The maximum adsorption capacity (\(\:{q}_{m}\)) of 416.67 mg/g demonstrates the high efficiency of AC5 in adsorbing crude oil, highlighting its substantial uptake capacity. The \(\:{R}_{L}\) value of 0.39 indicates that the adsorption process is favorable, as 0 \(\:{R}_{L}\)
The prediction of the Freundlich isotherm model using experimental data for crude oil removal is depicted in Fig. 15, which shows the linear plot of \(\:\text{log}{(q}_{e})\) versus \(\:\text{log}{(C}_{e})\), as detailed in Eq. (9). With an \(\:{R}^{2}\) value of 0.965, the Freundlich model fits the data better than the Langmuir isotherm (\(\:{R}^{2}\)= 0.934). This indicates that the Freundlich model more accurately describes the adsorption process, capturing the surface heterogeneity and multilayer adsorption better than the Langmuir model’s assumption of a uniform surface and monolayer adsorption. Additionally, the value of \(\:1/n\) was found to be 2.15. Since this value is greater than 1, it suggests a cooperative adsorption process, where the presence of already adsorbed oil molecules on the surface enhances the adsorption of subsequent molecules. This suggests that as more adsorbate (crude oil) is added, the adsorbent (AC5) has an increased capacity to adsorb, likely due to surface heterogeneity and the potential for multilayer adsorption.
Figure 16 presents the comparison between the Temkin isotherm model and the experimental data, where \(\:{q}_{e}\) is plotted vs. \(\:\text{ln}\left({C}_{e}\right)\) as defined in Eq. (11), showing a poor correlation. The low coefficient of determination (\(\:{R}^{2}\)= 0.822) suggests that the Temkin model does not accurately capture the adsorption characteristics in this study, indicating that the assumption of a linear change in adsorption energy with surface coverage is not appropriate for describing this adsorption behavior.
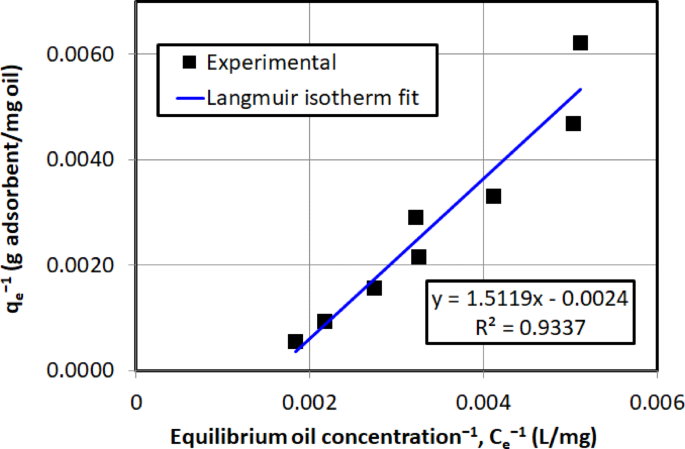
Equilibrium isotherm fit of crude oil adsorption onto AC5 using Langmuir isotherm model.
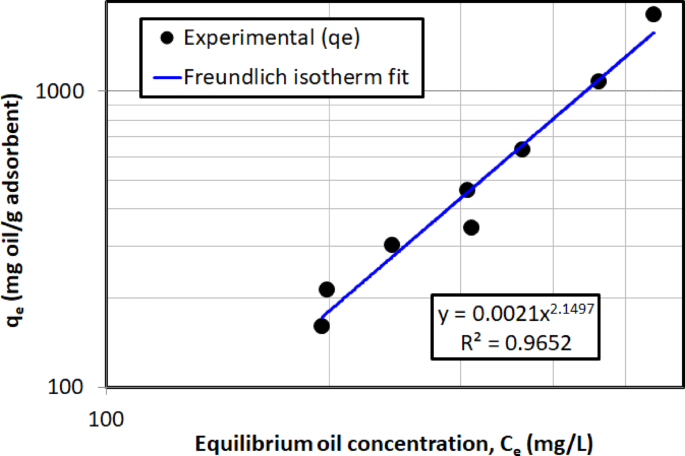
Equilibrium isotherm fit of crude oil adsorption onto AC5 using Freundlich isotherm model.
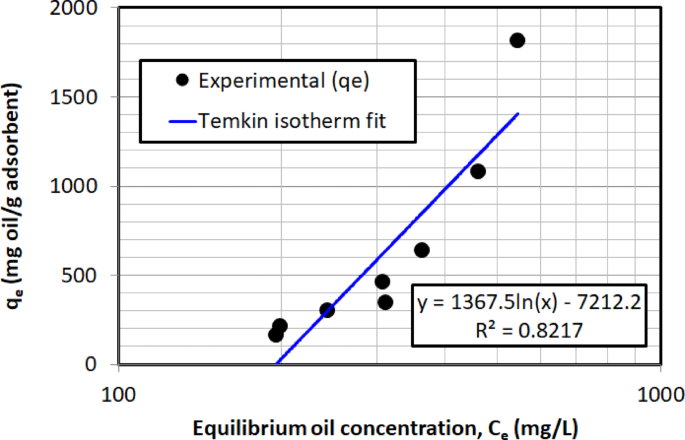
Equilibrium isotherm fit of crude oil adsorption onto AC5 using Temkin isotherm model.
Figure 17 presents a direct comparison between the experimental adsorption data and three isotherm models: Langmuir, Freundlich, and Temkin. The abscissa represents the equilibrium crude oil concentration in the aqueous phase (\(\:{C}_{e}\)), while the ordinate denotes the corresponding amount adsorbed onto AC5 (\(\:{q}_{e}\)). As evident from the plot, the Langmuir isotherm shows poor agreement with the experimental data, especially at higher concentrations, where it significantly overestimates the adsorption capacity. In contrast, the Freundlich model demonstrates a more consistent and accurate fit across the entire concentration range studied, suggesting that adsorption on AC5 occurs on a heterogeneous surface with possible multilayer interactions. The Temkin model captures the trend moderately well but deviates at both low and high concentrations. Therefore, based on the visual and quantitative agreement, the Freundlich isotherm appears to best describe the adsorption behavior of crude oil onto AC5 in this study.
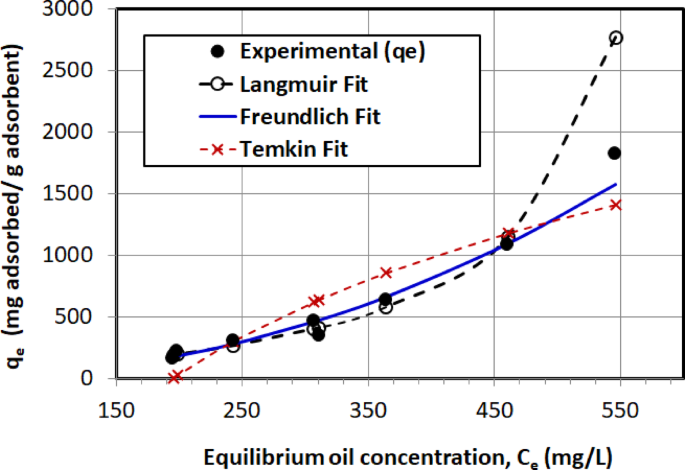
Isotherm fits of crude oil adsorption onto AC5.
The parameters and correlation coefficients (\(\:{R}^{2})\) for all three linearized isotherm models are summarized in Table 5. The Freundlich model best fits the experimental results of this study, as indicated by its superior \(\:{R}^{2}\) value compared to the other two models. The maximum adsorption capacity (\(\:{q}_{m}\)) derived from the Langmuir model was calculated to be 416.67 mg/g. It is important to note that this theoretical value is significantly lower than the experimental capacities observed at low dosages (e.g., 1816 mg/g). This discrepancy further confirms that the Langmuir model, which assumes monolayer coverage on a homogeneous surface, is not suitable for describing the complex, multilayer adsorption of crude oil onto the heterogeneous surface of AC5.
Adsorption kinetics
Figure 18 illustrates the experimental data fitted to the pseudo-second-order model, where \(\:t/{q}_{t}\) is plotted against t as described in Eq. (13). From the plot, the adsorption capacity (\(\:{q}_{e}\)) and the pseudo-second-order rate constant (\(\:{K}_{2}\)) were determined from the slope and y-intercept of the plot, respectively. Table 6 presents the values of \(\:{q}_{e}\), \(\:{K}_{2}\), and \(\:{R}^{2}\) for the linearized pseudo-second-order model for crude oil adsorption onto AC5. The high correlation coefficient (\(\:{R}^{2}\)= 0.999) and the calculated adsorption capacity were found to closely match the experimentally determined values.
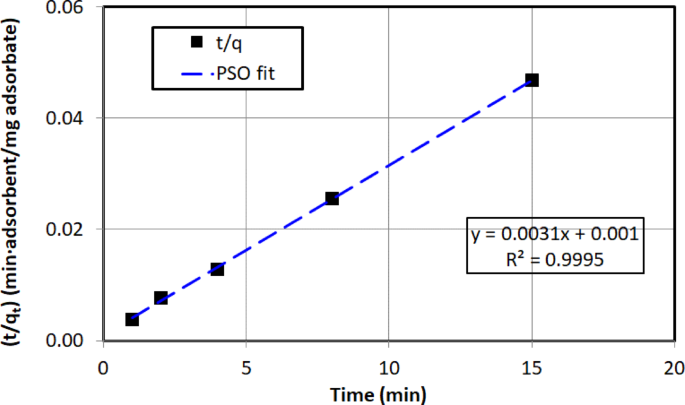
Pseudo-second-order kinetic model for crude oil adsorption onto AC5.
Comparative analysis of adsorption performance
To contextualize the performance of the activated carbons developed in this study, a comprehensive comparison was made with various adsorbents reported in the literature for crude oil removal. Table 7 summarizes the maximum adsorption capacities of different materials, including raw biomass, chars, and other activated carbons. The results of this comparison are highly significant. The optimized adsorbent from this study, AC5, demonstrated a maximum adsorption capacity of 1816 mg/g. This value not only surpasses that of other activated carbons derived from agricultural wastes like banana peels (356.2 mg/g) and barley straw (576.0 mg/g) but is also notably higher than that reported for a commercial activated carbon (1667 mg/g).
Most importantly, the performance of AC5 represents a substantial improvement over other activated carbons derived from the same date seed precursor. For instance, the previously reported capacity for a date seed AC was 191.00 mg/g46. The nearly an order of magnitude increase in adsorption capacity achieved in our work underscores the critical impact of our systematic optimization of the KOH activation process. While some raw biomass materials like corncob powder show high capacities, their practical application can be limited by low density and lack of structural integrity. Our study successfully produced a robust activated carbon that not only leverages a sustainable waste stream but also exhibits a performance that is competitive with, and even superior to, established commercial adsorbents. This highlights the significant potential of date palm seeds as a feedstock for producing high-performance materials for oil spill remediation.
Broader impact, scalability, and economic feasibility
The sustainability of the developed adsorbent is underscored by its significant potential for scalability and its economic viability, particularly within the agricultural and environmental context of Saudi Arabia. The primary precursor, date seeds, is not a niche material but an abundant agricultural waste, with the Kingdom producing over 1.5 million tons of dates annually. This abundant and consistent supply of feedstock is a critical factor that ensures the scalability of this process from the laboratory to an industrial level.
From an economic perspective, this optimization-driven strategy aligns with a “waste-to-wealth” model, transforming a low-value or even negative-cost material (considering disposal costs) into a high-performance adsorbent. Given the exceptional adsorption capacity achieved in this study—which surpasses that of commercial activated carbon—the developed material presents a promising and cost-effective alternative for industrial applications.
Furthermore, this work offers a compelling circular economy solution tailored to regional challenges. It leverages a prevalent agricultural waste—date seeds from the nation’s vast date farming industry—to address a pressing environmental issue: crude oil contamination from the petroleum industry. This dual-benefit approach not only reduces the burden on landfills but also provides a sustainable, locally sourced solution for oil remediation, aligning perfectly with national sustainability goals.