I used game data to visualize the historical performance of each NFL franchise using cumulative games above/below .500. The Cleveland Browns' chart is one of the most interesting. You can find all the charts here on Imgur.
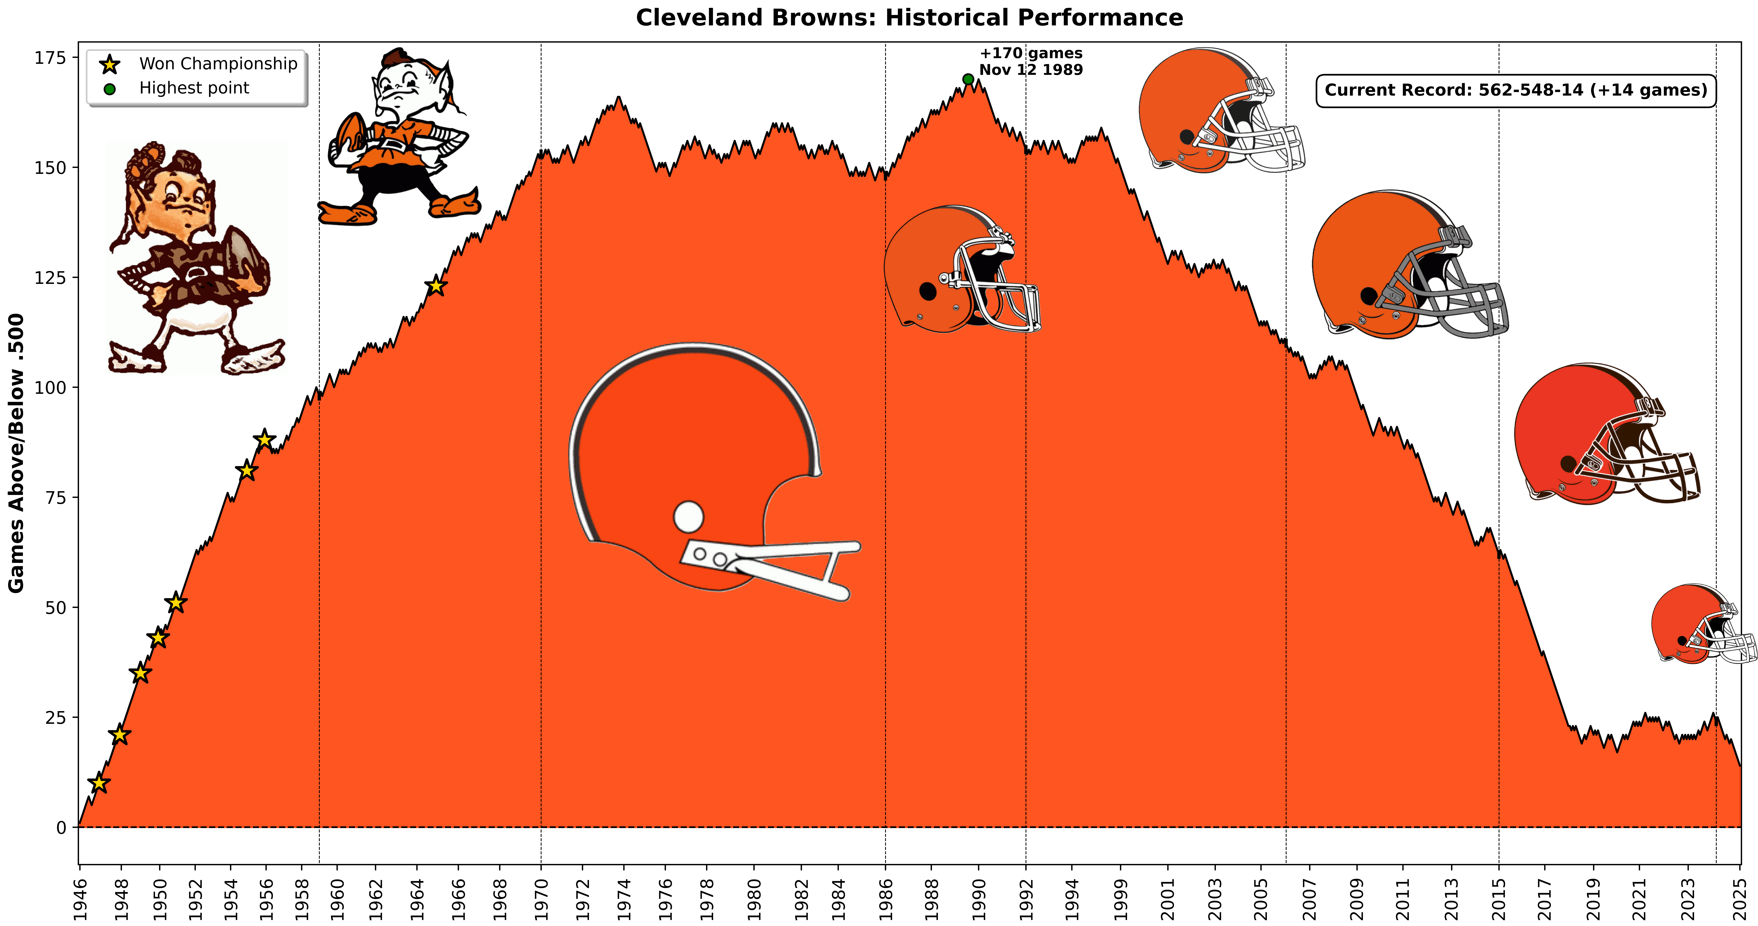
Methodology: A 0.500 record means a record with as many wins as losses (for exemple, 562 wins – 562 losses and 14 ties is a .500 record). Each win moves the line up (+1), each loss moves it down (-1), and ties keep the value unchanged. A vertical dotted line shows a logo change. Only regular season games are included.
Tools used: Python (BeautifulSoup4, matplotlib, pandas, numpy)
Sources: Pro Football Reference for the data and Sportslogo.net for the logos.
Posted by Ugluk4242
10 comments
This is really interesting. The past few years of mediocrity have saved them from going into the negative.
The logos look nice, but kind of funny to show the one thing that surely had no effect on the over-under, and not anything that might be related to the pattern of interest.
It’s wild that two decades of sucking – including that 1-32 stretch – wasn’t enough to take them under .500.
It’s weird to not have any indication of when the Browns became an entirely different team (nor the three-year period when there was no Cleveland Browns).
The Cleveland Browns moved to Baltimore in 1996 and became the Ravens, and an entirely new team was created in 1999 to become the new Cleveland Browns. Seems misleading to completely ignore this.
Rather than lines to indicate when they changed the team logo (a completely superficial detail), it would be more helpful to include a distinctive line in 1999, when they became a completely different set of players and personnel. That would add some really important context to that precipitous drop that resulted from their disastrous seasons as a new expansion team.
Almost the entirety of the decline here is the result of the Browns literally being a different team from the one that was dominant in the AFL during the ’50s and ’60s, and consistently competitive throughout the ’70s and ’80s. This is really the rise of the now-Baltimore Ravens and the consistent losing of the expansion Browns (who have only recorded 4 winning seasons in their 26 seasons of existence).
What would be really interesting would be to include a second overlapping chart starting 1996, showing what their record would be if the Baltimore Ravens had continued as the Cleveland Browns. Contrasted to those measly 4 winning seasons of the new Browns, the old Browns have had 18 winning seasons in that same time, continuing the “rise” of the original organization.
I love this visual!
It is funny that looking at the overall list ([List of all-time NFL win–loss records – Wikipedia](https://en.wikipedia.org/wiki/List_of_all-time_NFL_win%E2%80%93loss_records)) the Browns are in the middle of the pack … would love to do this with some of the other teams!
The Baltimore Ravens move is not on the list
They clearly need to bring back the elf
This is super interesting op. can you do thesame with the Bills?
I think instead of the “Browns” they should be called the “Poops”
TIL: the browns had a “rise” point in their history.
Comments are closed.