
Quick overview
WTI crude settled near $63.80 on Thursday as the summer driving season winds down. A bigger than expected draw in US crude inventories – 2.4 million barrels vs 1.9 million – should be short term bullish especially ahead of Labor Day.
But analysts say demand usually fades quickly post holiday. Traders are also watching how India responds to new US tariffs as Washington imposes 50% penalty on New Delhi for buying Russian oil.
While the tariffs are a concern, analysts expect India to keep imports steady in the near term so global supply impacts will be limited. Meanwhile, Russia-Ukraine energy strikes and a potential US rate cut are giving bulls some support.
Crude Oil (USOIL) Resistance at $64–65
On the 2 hour chart, crude is consolidating after breaking out of the rising channel. Immediate resistance is between $64–65 where the 50 period moving average (SMA) is at $63.82 and capping upside.
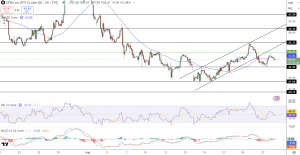 WTI Crude Oil Price Chart – Source: Tradingview
The RSI is 47 and neutral but downward, the MACD is flat and cautionary. Recent candlesticks with upper wicks at $64.20 show seller dominance in higher areas. Support is at $62.95 with further layers down at $61.66 and $60.73 – levels to test if bearish momentum resumes.
What to Do Now
For traders, it’s simple. Aggressive sellers can look to short below $62.95 and target the lower support zones at $61.66–$60.73 with stops above $64.20.
Meanwhile, patient buyers can wait for a break above $65.12 – a clean break of resistance – and then target $66.34 and $67.59.
Arslan Butt
Lead Markets Analyst – Multi-Asset (FX, Commodities, Crypto)
Arslan Butt serves as the Lead Commodities and Indices Analyst, bringing a wealth of expertise to the field. With an MBA in Behavioral Finance and active progress towards a Ph.D., Arslan possesses a deep understanding of market dynamics.
His professional journey includes a significant role as a senior analyst at a leading brokerage firm, complementing his extensive experience as a market analyst and day trader. Adept in educating others, Arslan has a commendable track record as an instructor and public speaker.
His incisive analyses, particularly within the realms of cryptocurrency and forex markets, are showcased across esteemed financial publications such as ForexCrunch, InsideBitcoins, and EconomyWatch, solidifying his reputation in the financial community.
Related Articles