Published on
August 29, 2025
By: Tuhin Sarkar

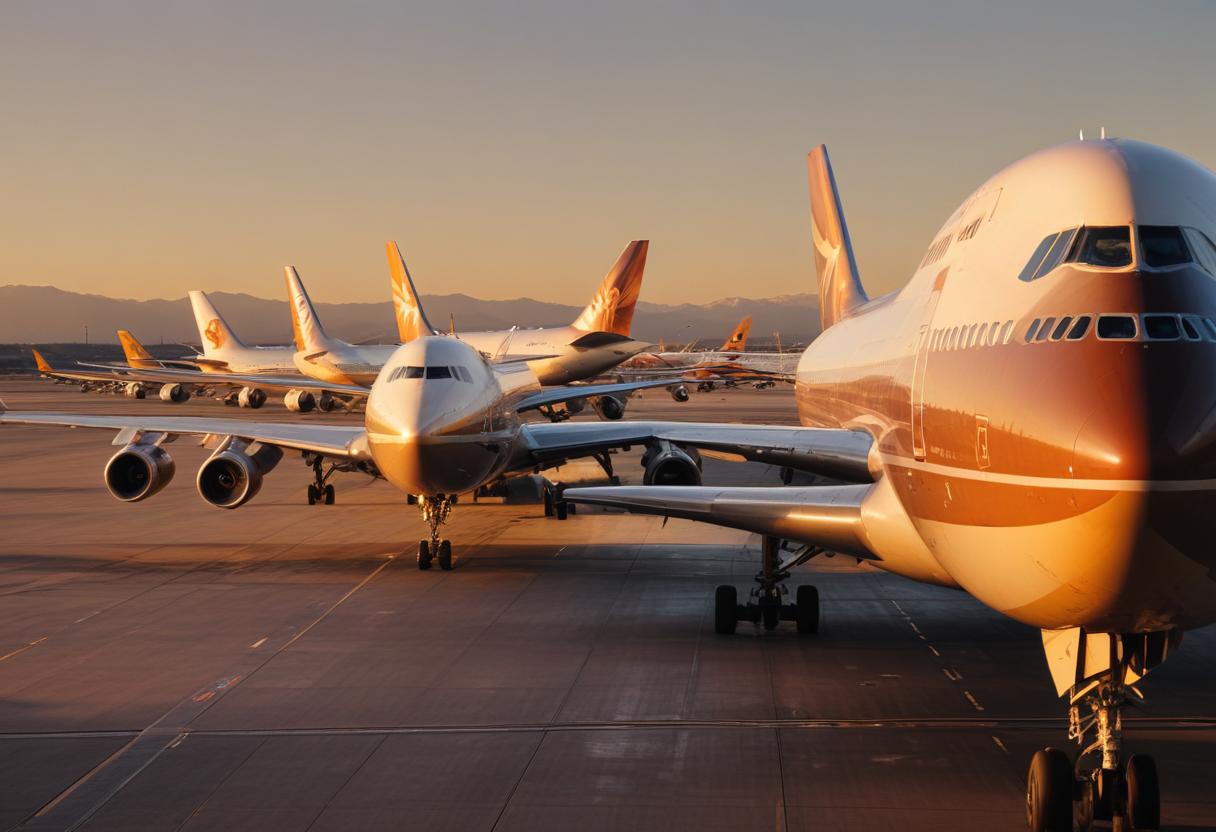
US, Brazil, China, Japan, and Australia domestic air travel performance in July 2025 is here, and every flyer needs to know how these major markets moved. Domestic air travel in the US remained strong with airlines managing high demand, while Brazil recorded the fastest growth, showing clear strength in passenger confidence. China kept expanding with more flights and steady passenger growth, though load factors slipped slightly.
Japan made history with its best July load factor in years, proving efficiency gains in a competitive market. Australia also showed resilience, with more travellers filling planes and capacity managed carefully. Together, the US, Brazil, China, Japan, and Australia account for a huge share of global travel. Their July 2025 performance shows how domestic aviation drives the wider recovery.
These countries reflect both the challenges and opportunities for airlines, from adding capacity to balancing demand. US, Brazil, China, Japan, and Australia domestic air travel numbers confirm the aviation industry’s momentum and highlight why every flyer should pay attention.
Domestic air travel markets showed mixed growth in July 2025, according to the latest IATA data. Across all tracked domestic markets, demand rose, though at different speeds. Airlines adjusted capacity and maintained high load factors, showing that local markets remain resilient. Together, these five domestic giants account for more than a quarter of the world’s passenger traffic.
Australia posted solid gains in July. Demand climbed 4.3% compared to July 2024. Capacity increased by 3%, which was lower than demand. This helped raise the load factor by a full percentage point to 85.1%. It shows Australians are flying more within their own country, with airlines managing supply effectively.
Brazil was the strongest performer of all domestic markets. Passenger demand jumped 9.4%, far higher than the global average. Airlines responded with a 7.5% increase in capacity. Even so, planes were fuller than ever. The load factor rose 1.5 points to reach 85.8%. This reflects strong demand for leisure travel and growing confidence in Brazil’s aviation recovery.
China also delivered growth, though at a slower pace than Brazil or Australia. Domestic demand rose 3.8% year-on-year. Capacity grew faster at 4.8%. As a result, the load factor slipped by 0.8 points to 82.1%. While still healthy, this shows airlines in China added more seats than passengers could fill. It highlights the balancing act facing Chinese carriers as they rebuild their networks.
Japan recorded a 2.9% increase in demand, despite cutting capacity by 1.2%. This mismatch pushed its load factor up by 3.3 points, to 81.4%. That is Japan’s best July load factor since at least the year 2000. It shows Japanese carriers are running leaner networks but filling their planes more efficiently. For such a competitive market, this is a notable milestone.
The United States, the world’s largest domestic market, grew by 1.5% in July. Airlines expanded capacity by 2.4%, leading to a small 0.8 point dip in load factor. Even so, the US kept one of the strongest figures worldwide at 87%. This reflects the strength and maturity of the American domestic market, where planes remain very full despite slower growth.
Overall, global domestic traffic rose 1.9% in July 2025. Capacity rose by 2.4%. The average load factor was 85.2%, down only 0.4 points from a year earlier. Brazil and Australia were clear leaders, while Japan stood out for efficiency gains. China and the US grew more slowly but still maintained large volumes.
The July figures confirm that domestic air travel continues to underpin the global aviation recovery. Each country’s results reflect unique dynamics, but together they show a stable and resilient sector. For airlines, the challenge will be to balance growth with profitability while keeping planes full.
Air Travel Gains Momentum with Strong July Performance
Air travel is growing again. The International Air Transport Association (IATA) reported that global passenger demand in July 2025 was up 4% compared with July 2024. Airlines offered 4.4% more seats. Planes were still full, with an average load factor of 85.5%, only slightly below last year. The northern summer season has been strong. International travel rose faster than domestic, and momentum appears to be carrying into September. IATA’s Director General Willie Walsh said this is a sign that airlines are well placed to continue benefiting from steady demand.
International Travel Leads the Recovery
International demand grew by 5.3% year-on-year in July. That is stronger than the 3.9% growth seen in June. Airlines added 5.8% more capacity, but their load factor slipped slightly to 85.6%. All major regions saw international growth, though load factors eased almost everywhere. Asia-Pacific was the star performer, with airlines recording 8.7% more demand than a year ago. Latin America also posted a strong gain of 9.3%, showing that leisure and business trips remain resilient. The Middle East saw a recovery after conflict-related disruptions in June, delivering 5.3% growth.
Domestic Travel Steady But Slower Than International
Domestic markets also expanded, but growth was weaker. Overall domestic demand rose 1.9% in July, with capacity up 2.4%. The average domestic load factor was 85.2%. Brazil stood out with a 9.4% jump in demand, while the United States grew 1.5%. Japan recorded a remarkable load factor of 81.4%, the highest for a July since 2000. China’s market expanded by 3.8%, although its load factor slipped slightly to 82.1%. Australia grew 4.3%, with an 85.1% load factor. These results show that domestic travel is stable, but the faster growth is in cross-border flying.
Regional Performance Highlights
Africa delivered steady growth. Traffic rose 3.9% year-on-year, with capacity up 4.4%. Load factors remained the lowest of any region at 75.1%, though they improved slightly compared to last year. Asia-Pacific airlines benefited from strong demand across both regional and long-haul markets. Their total RPKs rose 5.7% year-on-year, with capacity up 5.6%. The load factor held firm at 83.2%. Europe grew 2.9% in demand and 3.2% in capacity, with the highest regional load factor of 88%. North America, while growing just 1.9%, also had a strong 87.5% load factor. Latin America surged 7.2% in demand. The Middle East, still managing geopolitical disruption, grew 5.4% and maintained a solid 83.8% load factor.
International Routes Show Mixed Patterns
International routes between regions show where momentum is shifting. Traffic within Asia remained strong. Africa-Asia routes recorded sharp growth, giving airlines in both regions fresh opportunities. Middle East carriers regained momentum after conflict-related turbulence in June. In contrast, traffic between North and South America fell by 0.8%. Despite this, North American airlines kept some of the world’s strongest load factors. Latin America’s intra-regional traffic was a bright spot, fuelling its strong overall results. Europe’s carriers saw steady demand on both regional and intercontinental routes.
Brazil and Japan Drive Domestic Highlights
Among domestic markets, Brazil was the standout. Demand surged 9.4%, supported by strong leisure demand and economic stability. Airlines raised capacity by 7.5% and still lifted their load factor by 1.5 points to 85.8%. Japan’s 2.9% rise in demand was notable because capacity fell by 1.2%. This drove a sharp 3.3-point improvement in load factor, to a record July level of 81.4%. In the US, the world’s largest domestic market, demand increased 1.5% with a high 87% load factor. China continued its steady recovery with 3.8% growth, while Australia posted a healthy 4.3% gain. These numbers highlight how different national markets can move at very different speeds.
Load Factors Hold Strong Despite Capacity Growth
Airlines have been adding capacity to match growing demand, but load factors have stayed firm. The global average was 85.5% in July, just 0.4 points lower than a year ago. Europe led the world with 88%, while North America was close behind at 87.5%. Latin America maintained a high 85.7%, even though capacity outpaced demand. The Middle East achieved 83.8%, Asia-Pacific 83.2%, and Africa 75.1%. These figures show that aircraft remain full despite growth in available seats. It also demonstrates efficient capacity management by airlines across regions.
Signs of Stability After Earlier Slowdown
Earlier in 2025, growth had been slowing. But July data shows renewed strength. International traffic improved from June’s 3.9% growth to July’s 5.3%. Flight volumes in September are projected to rise 2% year-on-year, ending a five-month stretch of slower growth. This points to sustained demand through the late summer season. IATA believes airlines are now in a stronger position to build momentum into the year-end period. Strong demand for both leisure and business travel continues to drive the recovery.
Industry Analysis and Outlook
The July results underline that global aviation is on a steady growth path. Airlines are balancing capacity expansion with load factor control. Regions like Asia-Pacific and Latin America are leading the charge, while North America and Europe remain strong with high efficiency. Domestic markets provide stability, though growth is slower than in international travel. Key risks remain, including geopolitical disruptions, fuel costs, and economic uncertainty. Still, the July performance gives airlines optimism. With momentum picking up again, the industry is moving forward with confidence.
Global Airlines Ride Summer Strength
The IATA July 2025 data shows a positive picture for global aviation. Total demand rose 4%, led by international growth of 5.3%. Planes remain full, with load factors above 85% across most regions. Domestic markets are steady, with Brazil and Japan leading. International routes show varied trends but mostly positive momentum. The recovery is gaining pace again after earlier softness. For travellers, this means more flights, fuller planes, and airlines ready to capture demand. For the industry, it signals stability and resilience as aviation continues to power global connectivity.
