The use of hydraulic fracturing (fracking) in the United States, which began around 2008, has produced spectacular figures in the extraction of natural gas and, even more so, crude oil — but in this article we focus only on the first of these fuels. From that date until 2024, natural gas production rose from 550 billion cubic meters to over one trillion, eliminating the long-standing U.S. trade deficit in 2014 and generating a surplus that grew to 206 billion cubic meters in 2024.
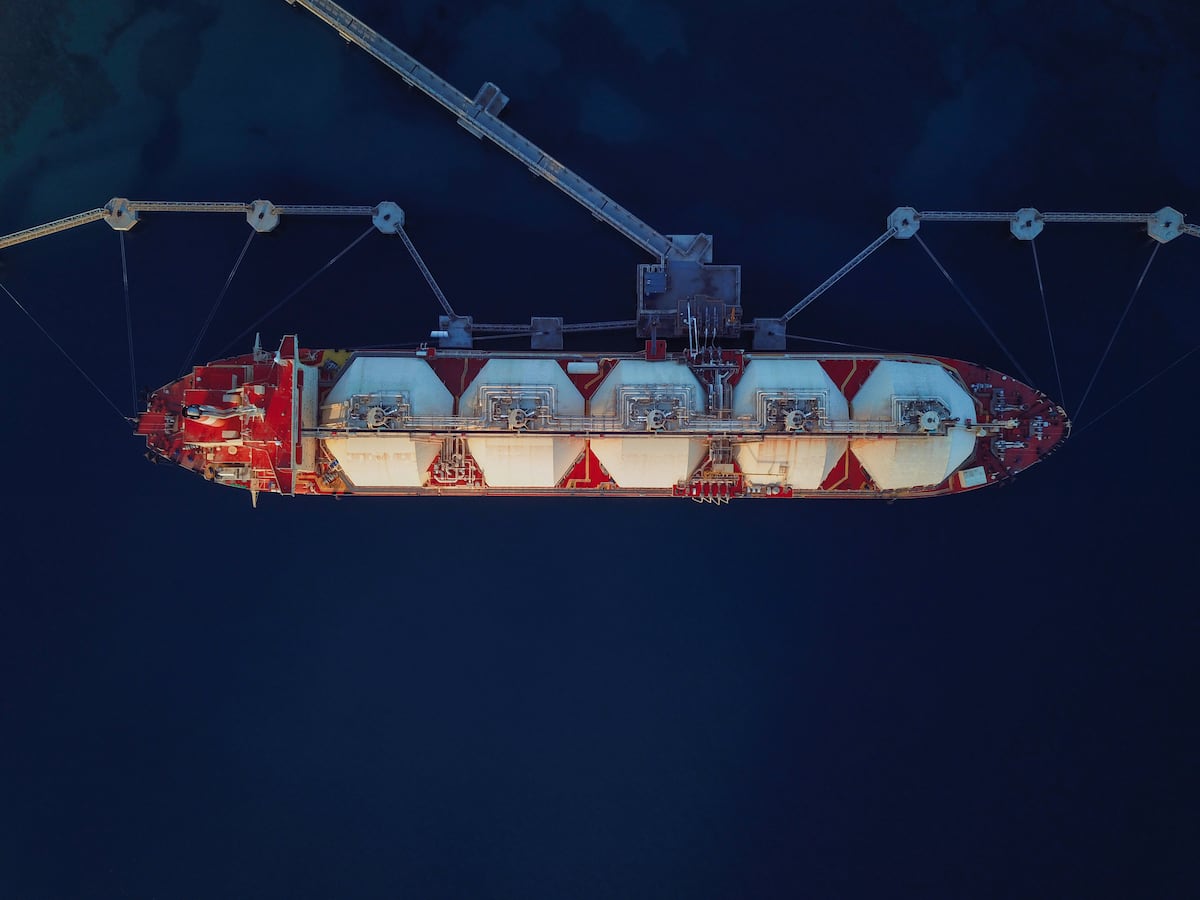
Part of that surplus could be absorbed by increased exports via pipelines to the two neighboring countries, with sales to Mexico and, especially, Canada — whose gas trade with the U.S. is substantial — rising to 90 billion cubic meters in 2024. However, the bulk of the surplus had to find new markets. To this end, liquefaction plants were rapidly installed along the coasts of Louisiana and Texas to convert gaseous fuel into liquefied natural gas (LNG), which could then be transported by tanker over long distances. The drawback was that LNG prices were significantly higher than those for pipeline gas, as they had to incorporate both the cost of liquefaction and the subsequent regasification at the destination, plus maritime freight.
Some of the LNG could be directed to Asian countries such as Japan, South Korea, and Taiwan, which had high domestic demand but limited domestic gas reserves, though they already had closer suppliers (Australia) and more established trading partners (Qatar). It could also go to countries like China and India, which were gradually increasing their modest consumption. Latin American, Middle Eastern, and African countries either consumed little natural gas or had their own supplies, leaving them with a narrow import margin. As a result, U.S. strategy led to Asian LNG sales reaching 39 billion cubic meters in 2024 and 15 billion cubic meters to other regions. Yet these expansions absorbed only part of the surplus gas converted into LNG.
Europe thus became a crucial target for the surplus, though it faced four major obstacles. First, European demand for natural gas was slowing. Second, most of their consumption came from Russia via an extensive pipeline network. Third, Russian imports were secured through long-term contracts with the Russian monopoly Gazprom. Fourth, although the contracts allowed some price fluctuations, they guaranteed stability and left little room for speculative opportunities created by price volatility and uncertainty.
By 2019, Europe had increased LNG imports to 113 billion cubic meters, but only 18 of these came from the United States. Two-thirds of natural gas imports still came via pipelines, 80% of which were supplied by Russia, with expectations of higher shipments once the second line of the Nord Stream pipeline, connecting Siberian fields to northern Germany via the Baltic Sea, became operational. These dynamics remained in 2021, after European consumption and imports had moderated — until February 2022, when Russia invaded Ukraine, sparking the ongoing military conflict. In solidarity against Russia, the European Commission decided to break energy dependence on Russia and take other economic and diplomatic retaliatory measures, supported by the Biden administration.
Three years later, 2024 data show four key consequences. First, European pipeline purchases have dropped sharply, to half of what they were in 2019, with Russian deliveries now only a quarter of their previous level. Second, LNG imports have grown to surpass pipeline purchases. Third, U.S. shipments have surged to 61 billion cubic meters, accounting for half of Europe’s LNG imports. Fourth, the United States has become the world leader in LNG exports (22% of the total), whereas in 2016 it exported none, and in 2019 it ranked third, far behind Qatar and Australia.
This represents a complete success of U.S. strategy and a favorable scenario for certain European gas multinationals, major shipping companies, commodity traders, and banks and funds seeking the creation of a large LNG market similar to that of oil, enabling financial operations. Contracts signed by major importers are long-term, typically 20–25 years, but prices are indexed to the TTF (Title Transfer Facility). This indicator is formed in a virtual market based in the Netherlands, where spot and futures contracts are traded. It is heavily influenced by financial actors, giving the index substantial volatility.
This context explains Europe’s and the U.S.’s lack of interest in investigating the Nord Stream II sabotage, whose neutralization had been noted as a key goal by the Biden administration. It also explains Europe’s indifference to the decline in LNG purchases from former main suppliers — Qatar, Algeria, and Nigeria — even though their prices are significantly lower than U.S. LNG. Finally, it explains the silence of EU authorities regarding the growing use of fracked U.S. gas, a technique prohibited by EU regulations due to environmental and health concerns.
Beyond strategic goals, the U.S. has created a highly lucrative business with multiple ramifications: LNG sales generate around $30 billion in revenue, more than half of which comes from European purchases. These figures are expected to continue growing, given the European Commission’s determination to deepen its break with Russia and the Trump administration’s public calls for European countries to increase U.S. LNG imports.
Enrique Palazuelos was Professor of Applied Economics at the Complutense University of Madrid until his retirement.
