![[OC] Firearm mortality rate per 100,000 for children and teens ages 1-19 years, U.S. state (2021)](https://www.europesays.com/wp-content/uploads/2025/08/0d3mj1d5ldmf1-1920x1024.png)
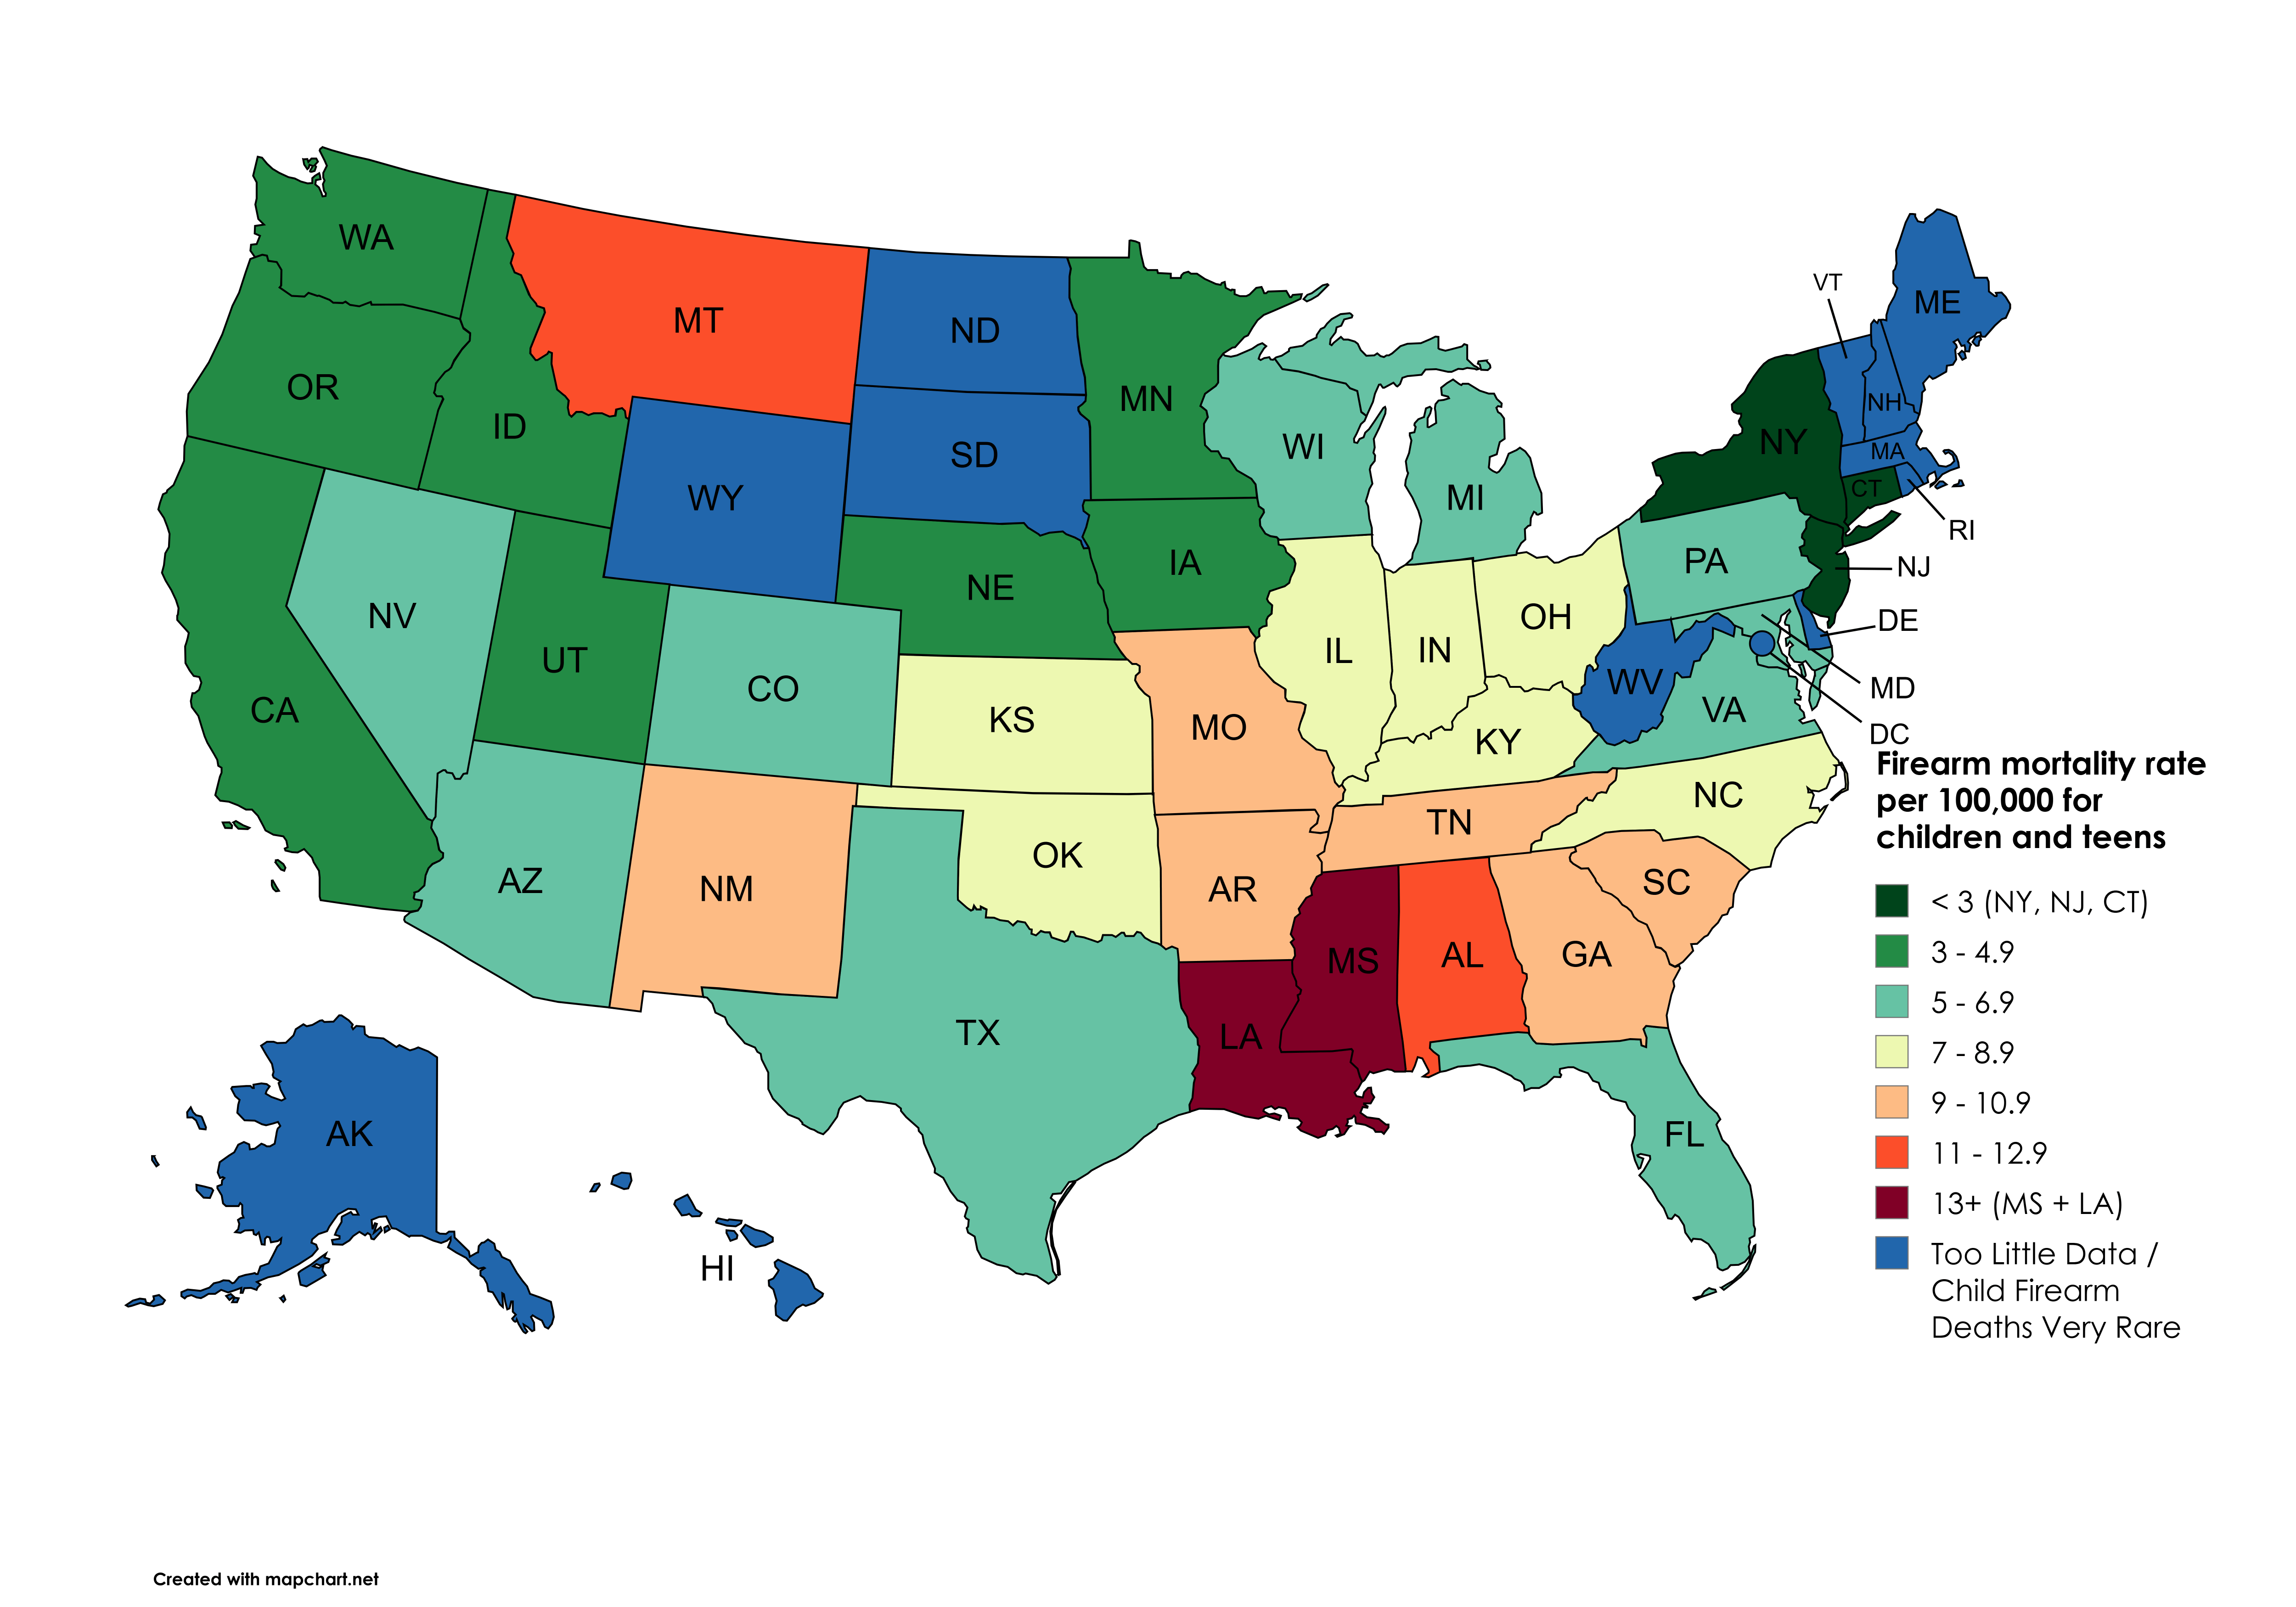
Data: CDC Wonder Injury Mechanism & All Other Leading Causes of Death data were used for the U.S. Rates for 12 states and D.C. are suppressed by the CDC because they had fewer than 20 firearm deaths among children ages 1-19 years.
Visualization: https://www.mapchart.net/usa.html
Posted by snakkerdudaniel
33 comments
Overlay that with gun ownership per capita. Will probably look similar.
“too little data” is very different from “very rare”
Was West Virginia “Too Little Data” or “Very Rare”?
I haven’t figured out this map yet, but as soon as I do, I’m going to let you all know how it confirms my pre-existing opinions about politics
Compare this to where Trump is sending National Guard troops.
These topics are not as useful UNLESS the data is broken down into: 1. Suicide or 2. Homicide. Suicide is 55% of all firearm deaths in America (most don’t realize it is that high of a % of the total).
[deleted]
looks like trump should send the national guard to mississippi
The too little data/ very rare should be grey (or some other non-colorful color) not blue if it’s a result of too little data. Ideally these categories can be separated out though since they are very different. Make too little data grey and very rare blue and put the blue in the right spot on the legend.
What makes LA and MS so much different from the rest of the US? It certainly *isn’t* gun ownership rates. I.e., the 8% raw/16% relative increase in ownership rates between VA and LA don’t explain the nearly 300% increase in gun homicides under 20.
I wonder if the map would look different between Under 13 vs 13-19, i.e. children dying from accidents/homicides vs teens/young adults shooting each other in relation to gang crime.
Reading a bit about LA crime rates, it seems like it is centered around New Orleans in general and spent almost 20 years as the murder capital of the US.
Anything above 0 is scarily high.
I am trying to understand what is going on with Montana
Florida is finally beating California.
Having a category that is two very separate things (too little data vs very rare) makes this decidedly “not beautiful”. Not to mention you already have a category that is <3, so goes to zero. How can “very rare” be more rare than zero?
The title is a bit confusing and might need a little rewording.
Is this like….how many deaths per 100,000 instances of teens using a firearm? Or deaths per 100,000 teens, how many of those deaths are caused by firearms? Currently, the data range itself is on the lower end, so using total counts may make more sense.
Why are we lumping in 18 and 19 year olds with children?
What’s up with Montana specifically?
The south is always a shitshow.
Possibly worth noting- Oregon has a lower firearm mortality rate than Texas, at the same time Oregon has more firearms per capita than Texas.
Make the Blue white instead easier to read
I always wish mortality rate from gun deaths was presented as accidental, homicide, and suicide instead of one massive plot.
Note that many / most of those “children and teens” are specifically older teenage boys and young men (18 and 19 is an adult) not children as the term is generally meant; and not accidental. Takehome message here is mostly “wow, gang membership and behavior starts young.”
I’m going to guess the Illinois problems are a result of lax enforcement in Indiana and Missouri.
Tristate goated as always
It will always feel wrong to me to lump homicides, suicides, and firearm accidents into the same data set.
Are we doing this again? “Firearm” deaths include suicides, homicides and accidents. Those are all very different problems with very different policy considerations. To neglect to consider that, so you can blame them all on guns, is the opposite of incisive.
Around 24% of gun-related homicides occur in census tracts where only 1.5% of Americans reside. Fifty percent of gun-related crime occurs in only 200 cities (there are over 100,000 cities in the US).
Gun crime tracks with poverty, density, and high levels of illicit activity. Suicide is very different. You will see high levels of both in states with low personal income, poor infrastructure and near-zero safety net. Because that is what needs tackling.
Looks like the South needs a military deployment.
Why am I not surprised those two states are the darkest red.
So weird how it’s always the same fucking states with the worst everything who just so happen to be the mot religious and the most red.
What’s not mentioned is whether these results are statistically significant. As in, we’re talking about differences of single digit deaths in populations of millions.
The South is winning again!!!
Jarvis pull up Black Population distribution map
The fundamental flaw is that 18 and 19 year olds aren’t children. This has been a longstanding problem in violent death statistics, and in no way is my comment a slap at OP. The chart is very nice and informative.
Any firearm death between 15 and 25 has a strong likelihood of being gang violence, but lumping the 15-19 year olds with the 14 and under group is really misleading.
Comments are closed.