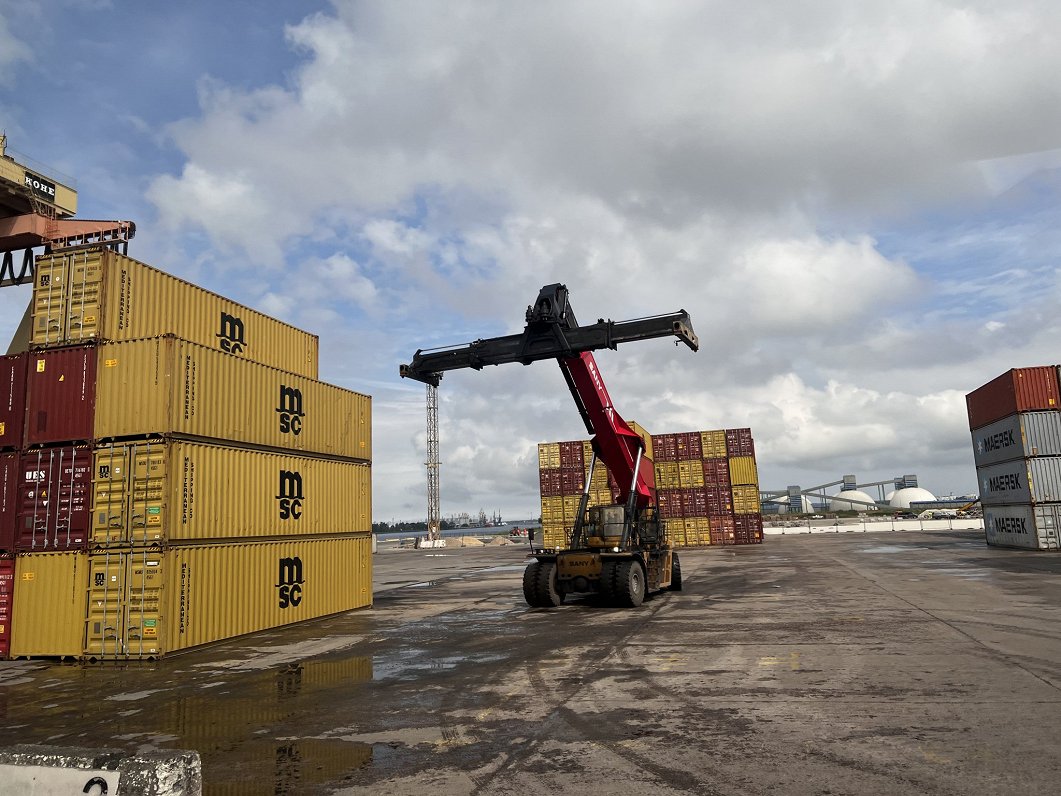
In the first half of 2025 the amount of cargo loaded and unloaded at Latvia’s ports comprised 17.3 million tonnes, which is 3.5 % less than in H1 2024.
Freight turnover at Rīga port was 8.1 million tonnes, 9 % less, at Ventspils port – 4.5 million tonnes or 14.5 % more, at Liepāja port – 3.4 million tonnes or 7.2 % less, but at minor ports – 1.3 million tonnes or 9.7 % less.
In H1 2025 freight loaded at ports comprised 12.5 million tonnes, which is 7.4 % less than in H1 2024. 6 million tonnes of bulk cargoes were loaded (drop of 17 %), 1.7 million tonnes of liquid cargoes (rise of 56.9 %) and 4.8 million tonnes of general cargoes (fall of 7.2 %).
4.8 million tonnes of freight were unloaded at ports, their volume rose by 8.4 %. 1.5 million tonnes of bulk cargoes were unloaded (drop of 8.1 %), 1.5 million tonnes of liquid cargoes (rise of 32.7 %) and 1.8 million tonnes of general cargoes (upturn of 7.7 %).
During the same period road transport freight comprised 35.3 million tonnes, which is 2 % more than in H1 2024. Transportation of international freights accounted for 8.7 million tonnes – 8.7 % more and export freight transport comprised 2.3 million tonnes, 7.7 % more.
Transportation of import freight fell by 3.1 % and comprised 1.6 million tonnes of freight. Cross-trade and cabotage freights comprised 4.8 million tonnes, which is 13.8 % more than in H1 2024. 81.7 % of total road freights were transportation for hire or reward. They rose by 4 %.
Rail transport freight comprised 4.4 million tonnes, which is 26.1 % less than in H1 2024. National freights by rail comprised 0.8 million tonnes – 3.3 % less. In international traffic the volume of freight transported by rail comprised 3.6 million tonnes, a drop of 29.6 %. Of which export freight transport – 0.6 million tonnes, 35.1 % less, import freight transport – 2.5 million tonnes, 32.8 % less, but goods in transit – 0.5 million tonnes, 10.4 % more.
Freight transport by land in H1 2025 (million tonnes)
I-VI, 2021
I-VI, 2022
I-VI, 2023
I-VI, 2024
I-VI, 2025
Changes, %
I-VI, 2025 / I-VI, 2024
Total
47.8
49.9
41.7
40.6
39.7
-2.1
rail transport
10.2
12.1
7.7
5.9
4.4
-26.1
road transport
37.6
37.8
34.0
34.7
35.3
2.0
Refer to the OSP database:TRK030c, TRK120c
Select text and press Ctrl+Enter to send a suggested correction to the editor
Select text and press Report a mistake to send a suggested correction to the editor
Tell us about a mistake
