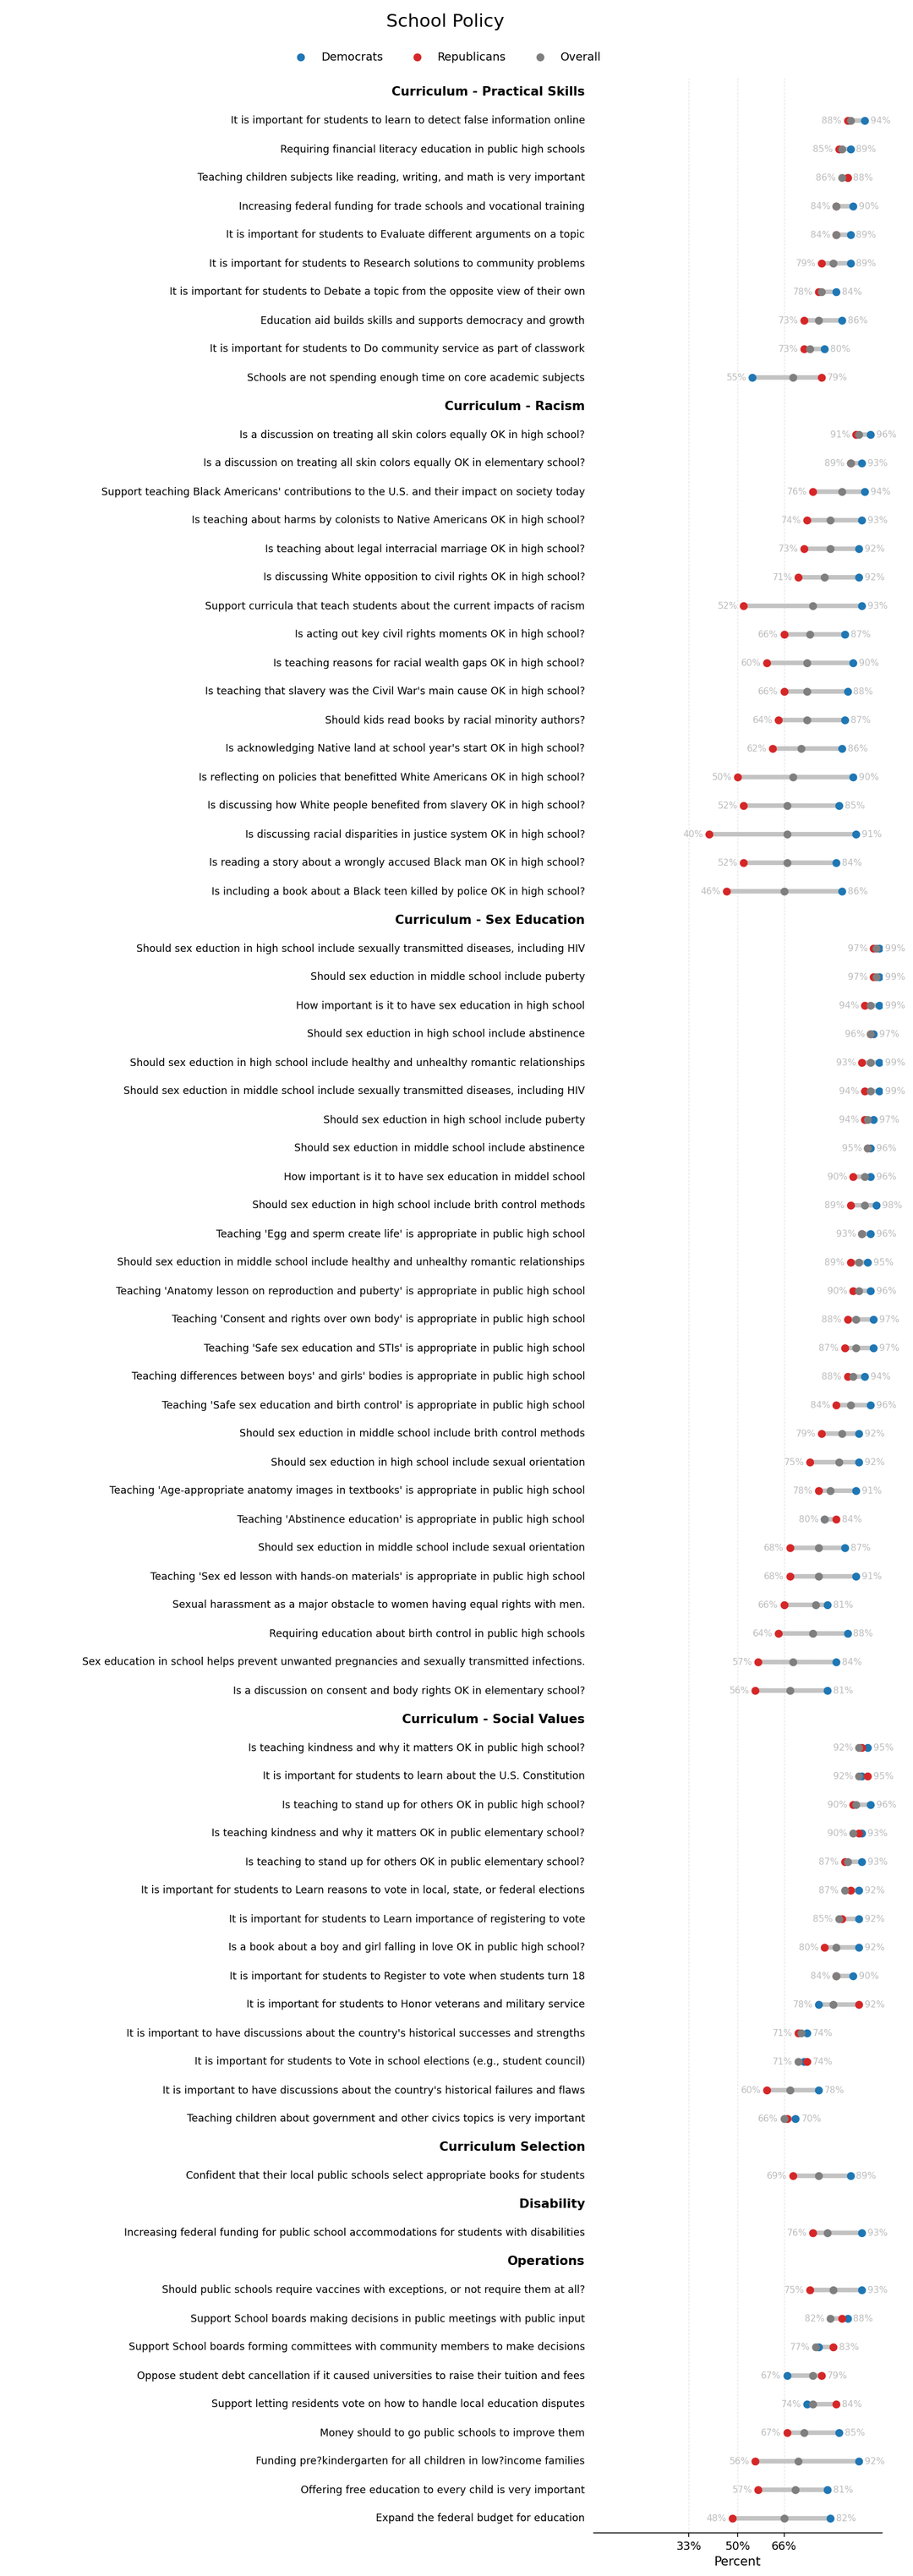
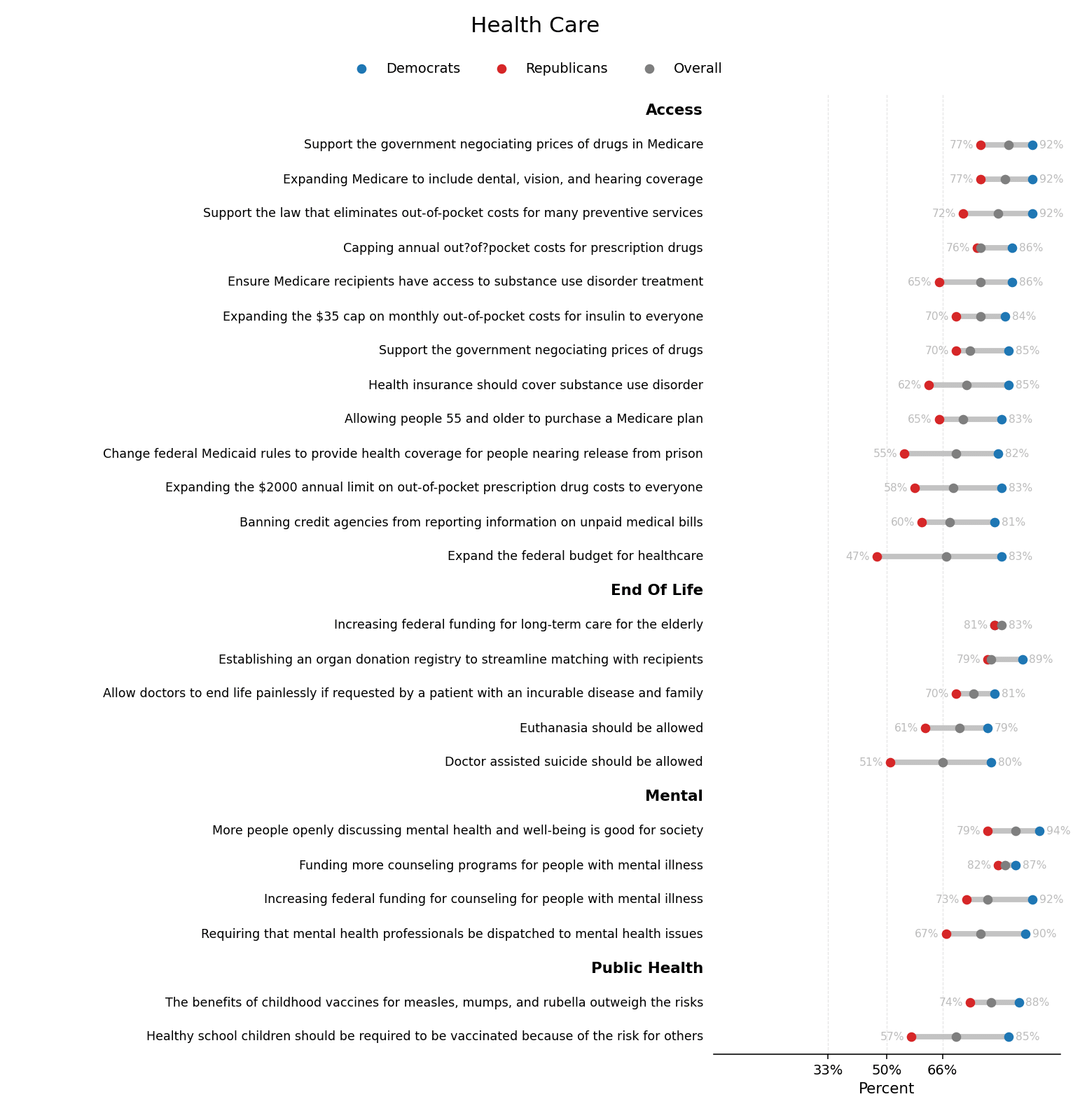
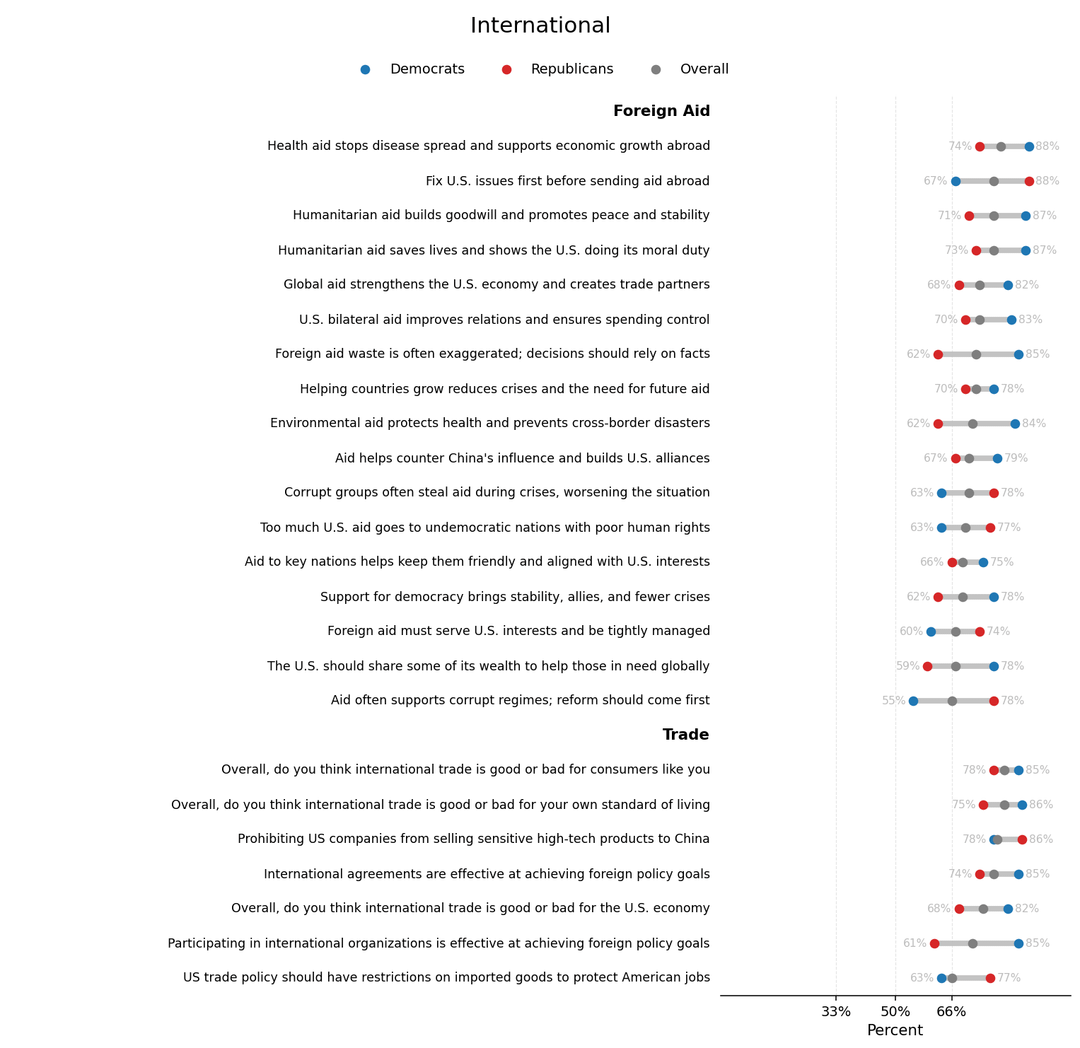
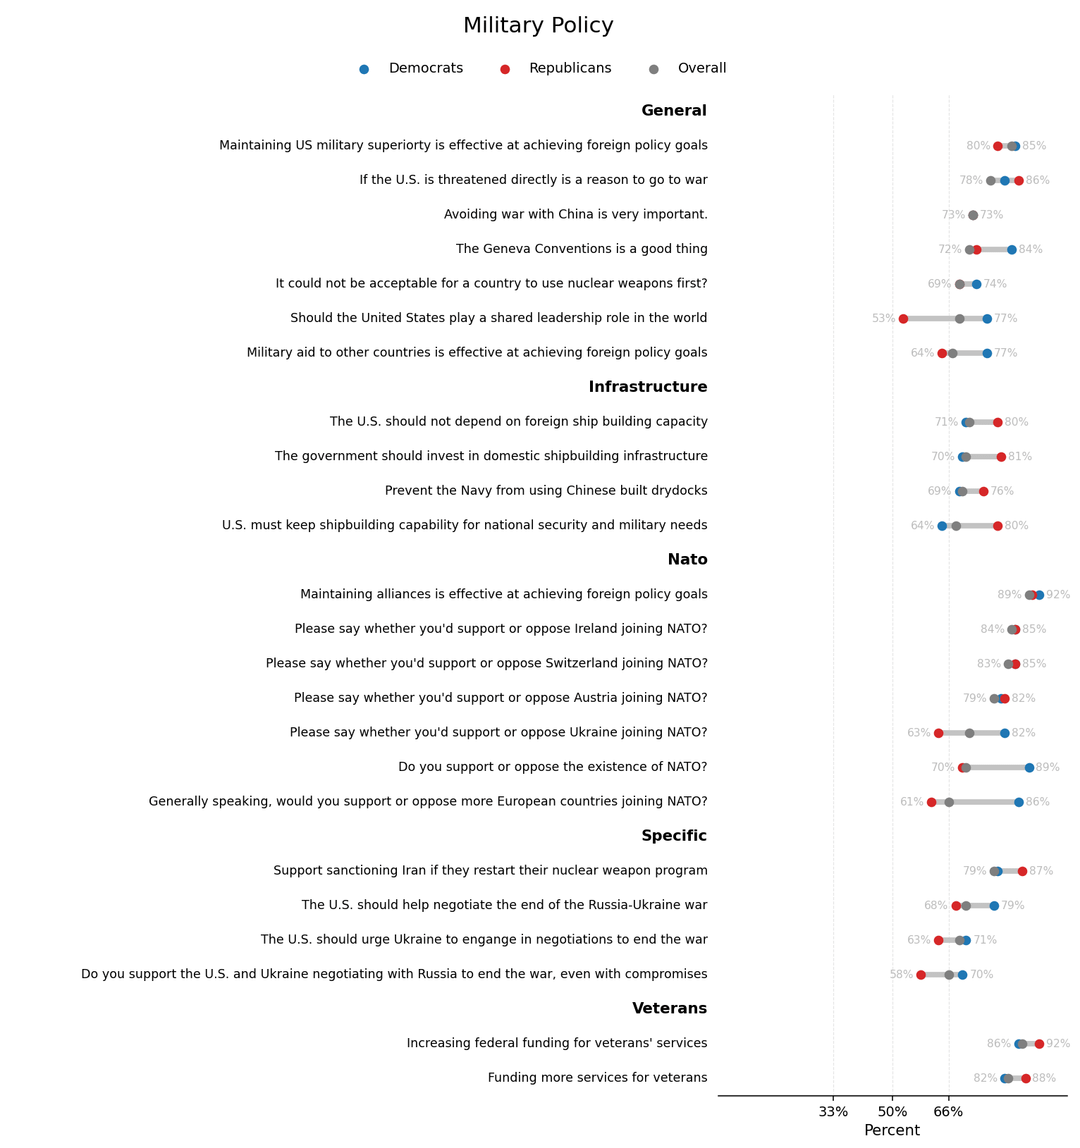
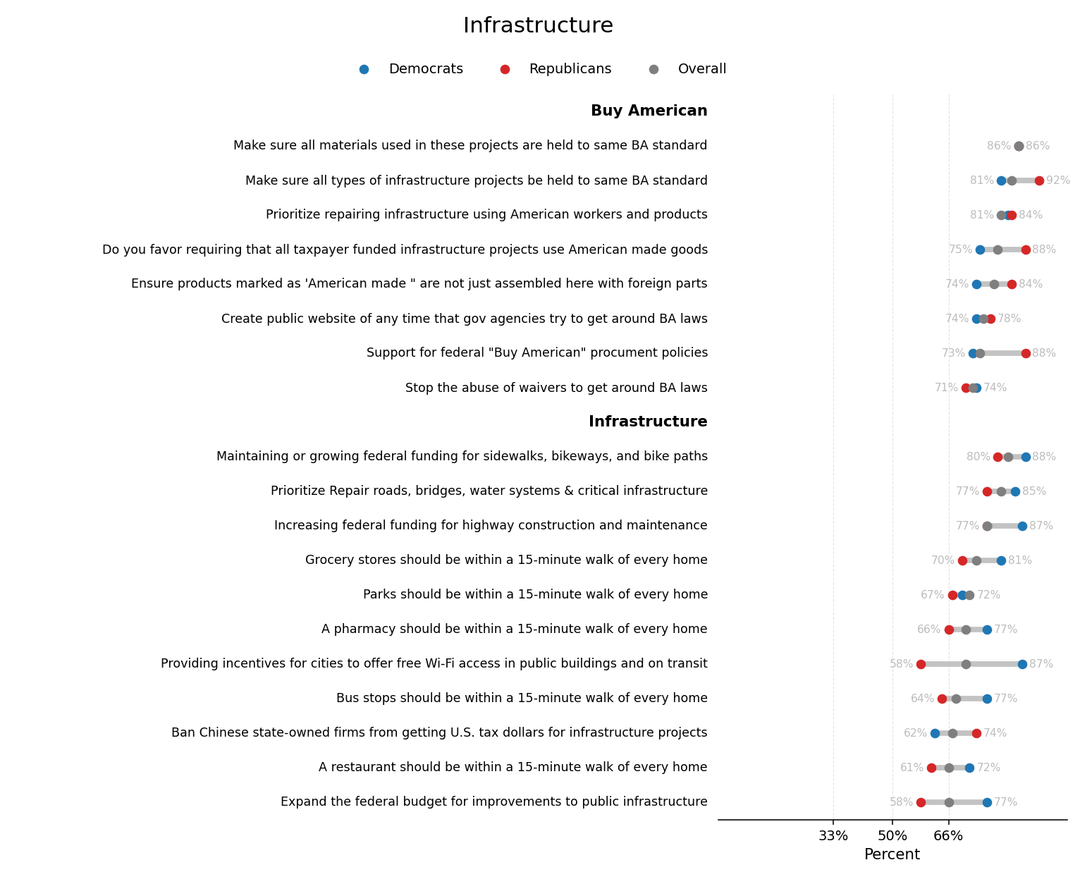
This project was created to try to find areas where Americans agree and are able to get past partisanship. After searching hundreds of polls, 671 questions were found to have at least 66% support. This data has been compiled into the TwoThirds Platform link below.
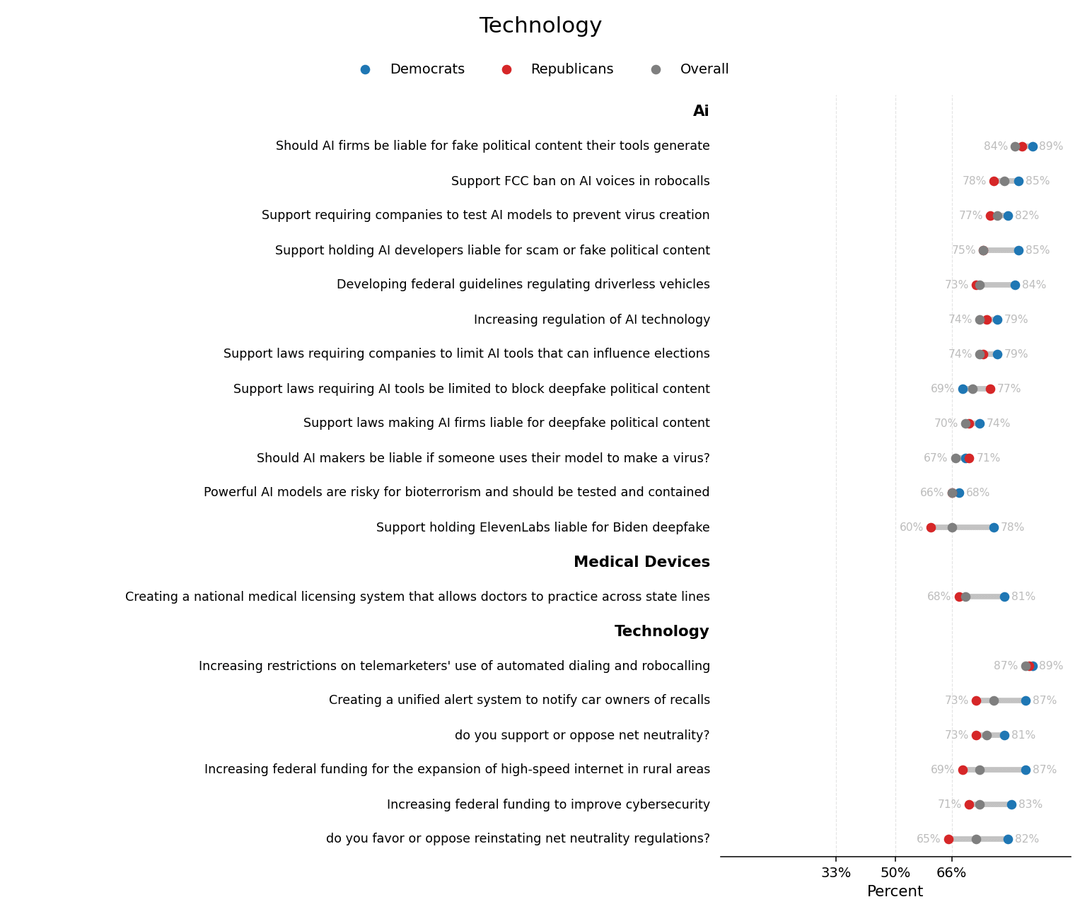
I have to laugh about the detecting false information ones…
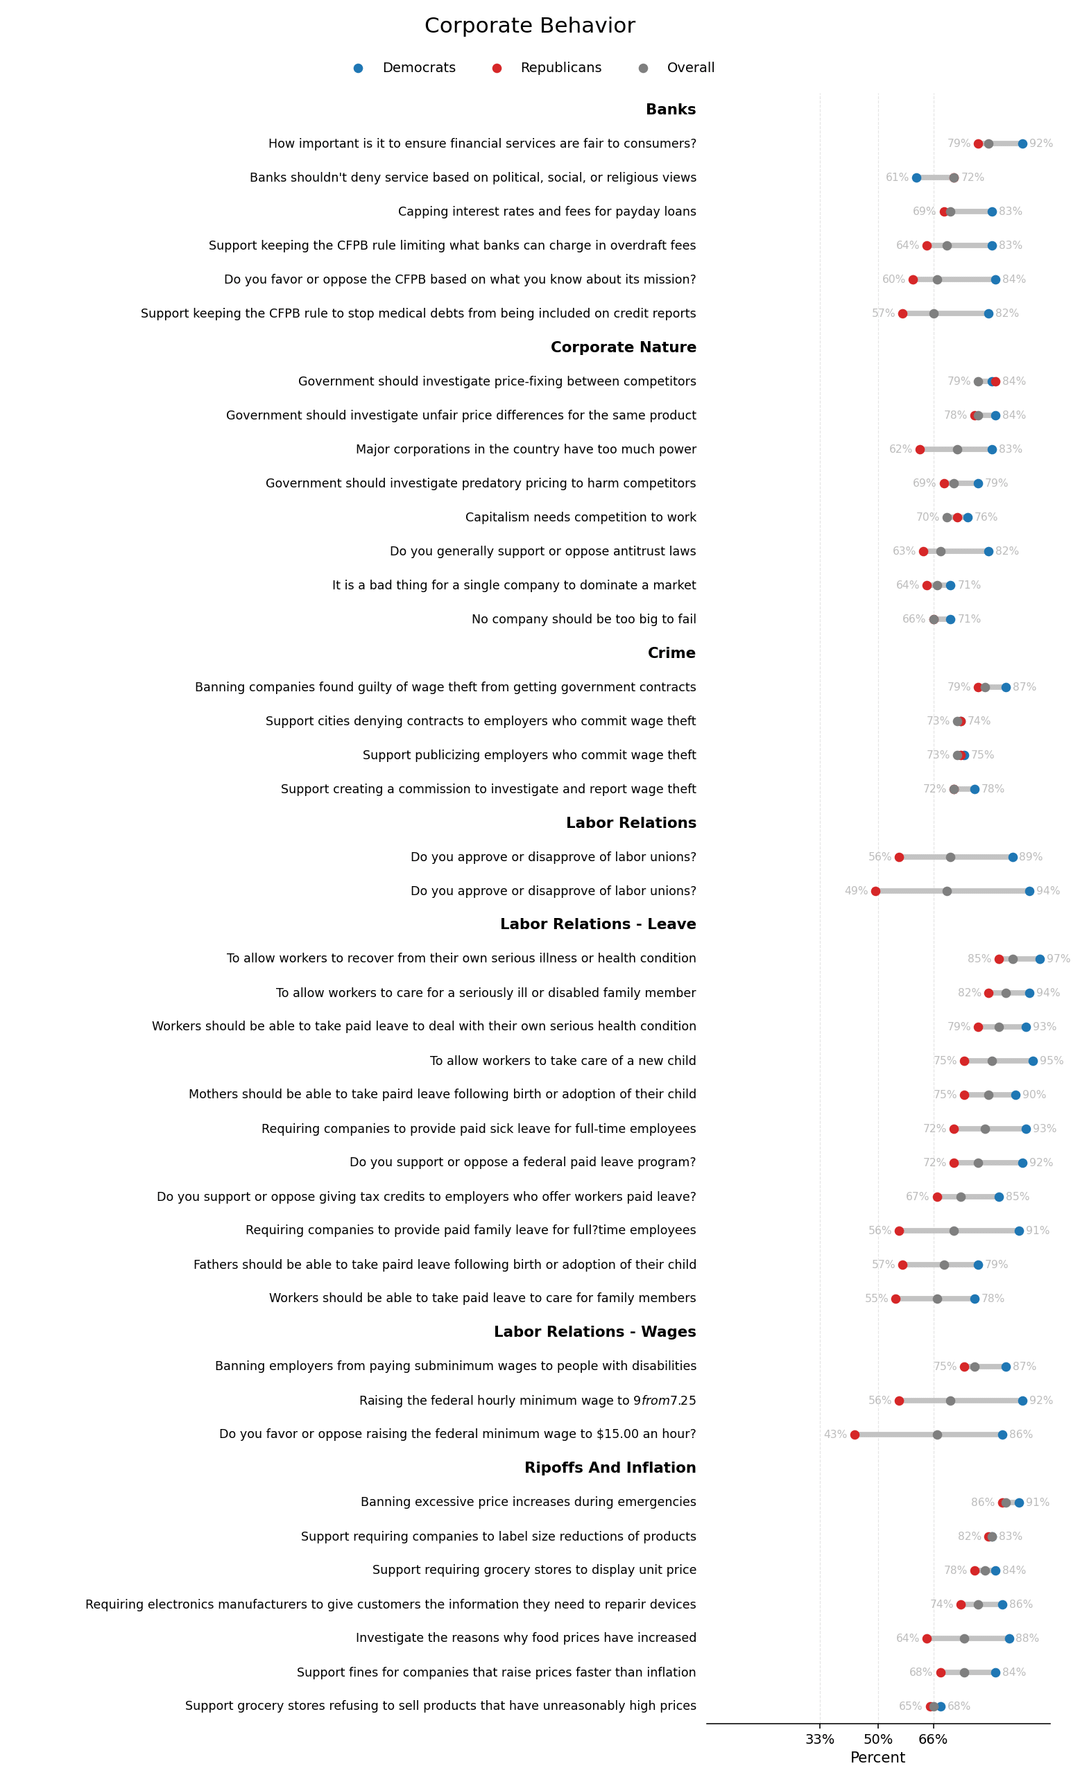
**Labor Relations**
Do you approve or disapprove of labor unions? (56%) <-> (89%)
Do you approve or disapprove of labor unions? (49%) <-> (94%)
wat?!
Data for ants? It is interesting, thank you for compiling it.
Support for labor unions (under labor relations) has two entries with different percentages.
Are you open to feedback on this? It’s difficult to look at something at the top of the image then have to go down to see what the percentage indicators are at the very bottom of the chart. It would be helpful to have the 33/50/66 thing at the top as well.
As with half the posts here, this belongs in a sub called datayoumightfindinteresting not dataisbeautiful
This post approved by the American Optometry Association.
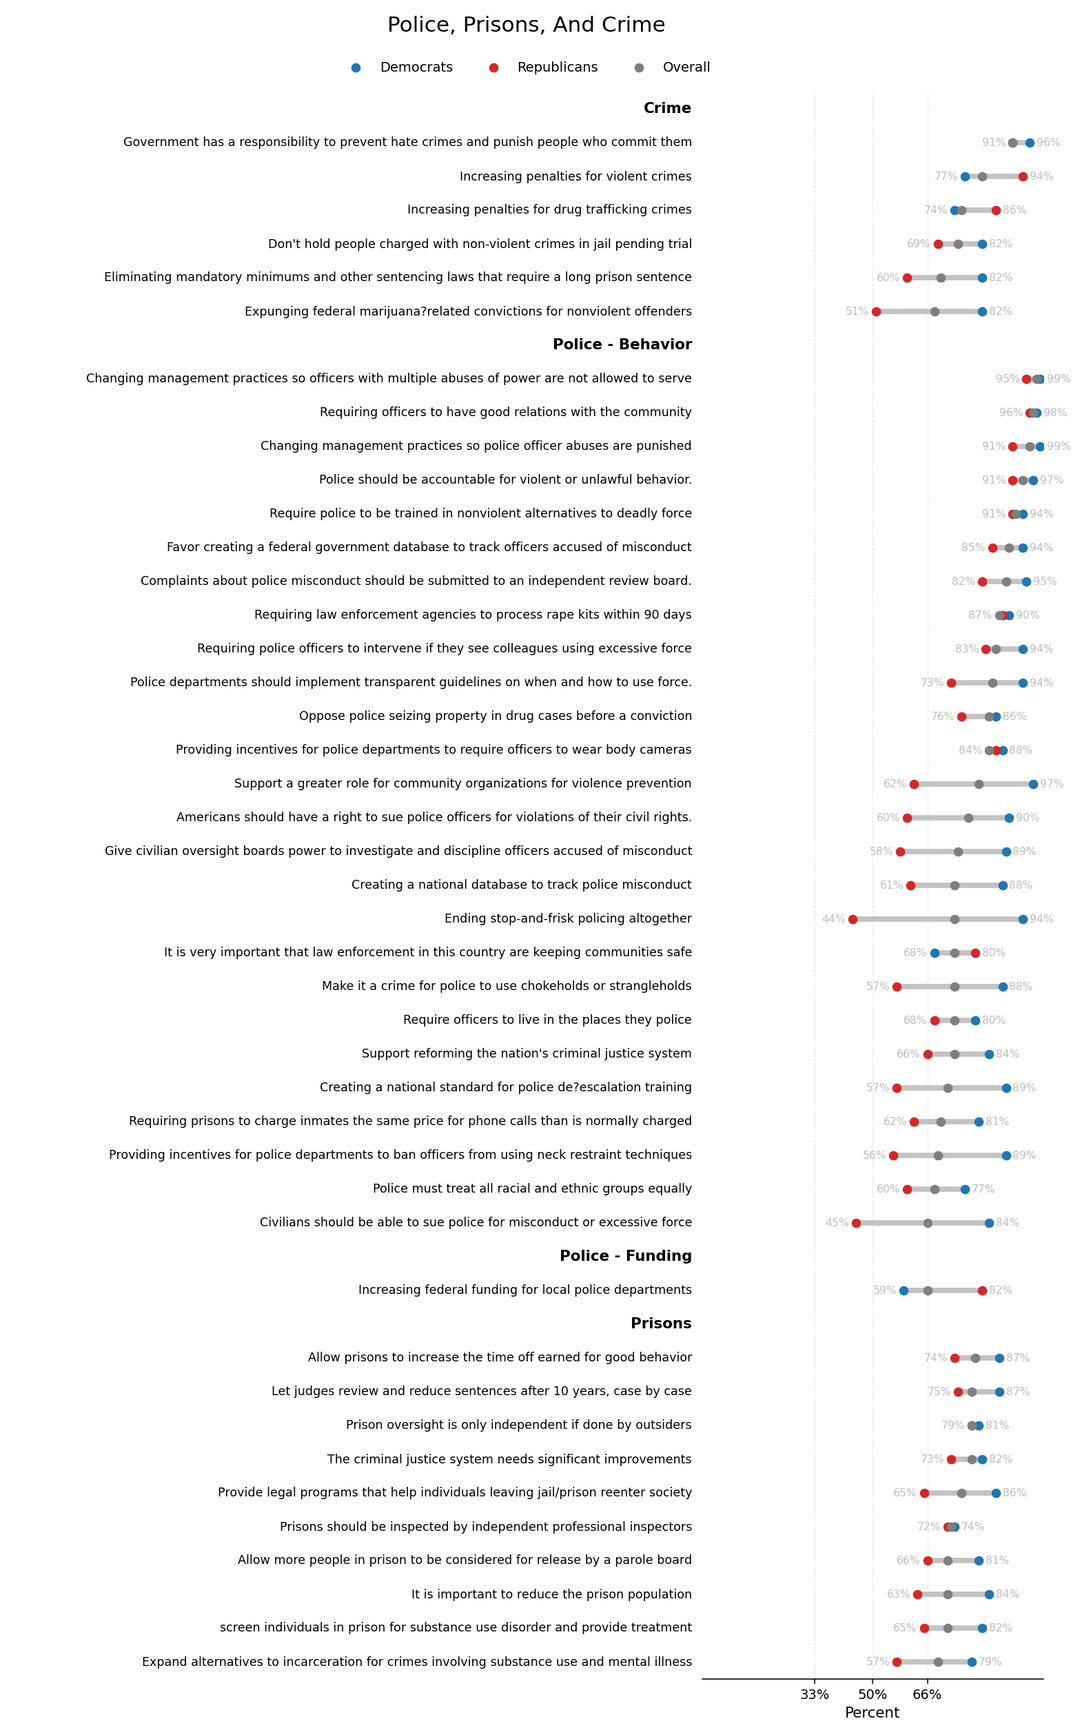
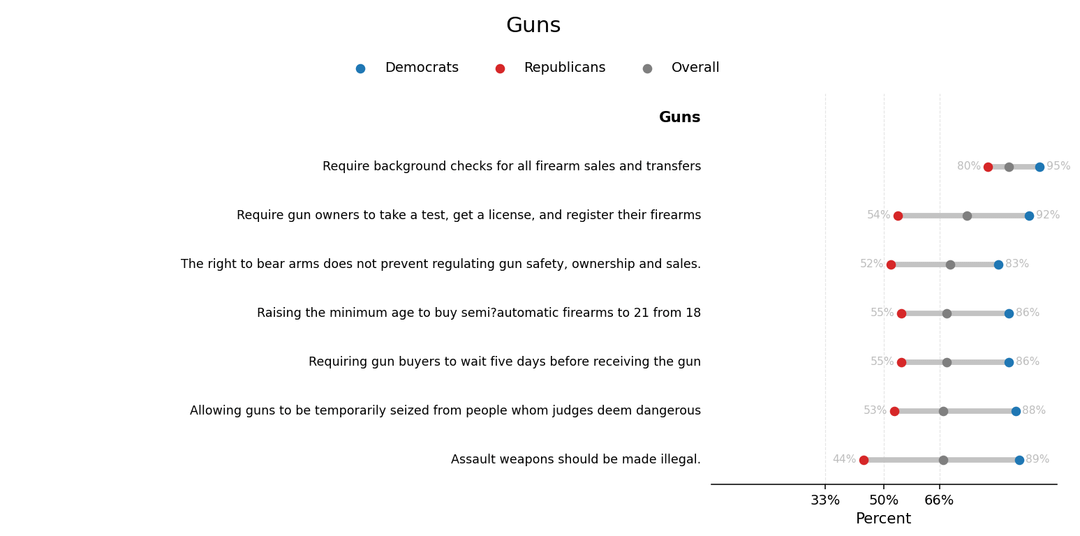
This is not “finding super majority support” because that implies finding bills both sides would support. This is just a list of extremely broad questions. For example, everyone will agree school shootings are bad but sides will differ on supported solutions.
Interesting visualization. Related, I’d love to see where left and right agree/disagree on core problems to be addressed. I’m guessing there is significant alignment on things like gun violence, crime, education, etc. The differences often emerge in the ways that left and right want to solve those issues.
Heads up, there are a *lot* of typos in this dataset.
There are also some questions that are ambiguous when reporting responses as a %, like “Should public schools require vaccines with exceptions, or not require them at all?” Why not just leave out the final phrase, since the outcome is expressed as % agreement? Or phrase as “as opposed to not requiring them at all” if you want to be specific about the alternative.
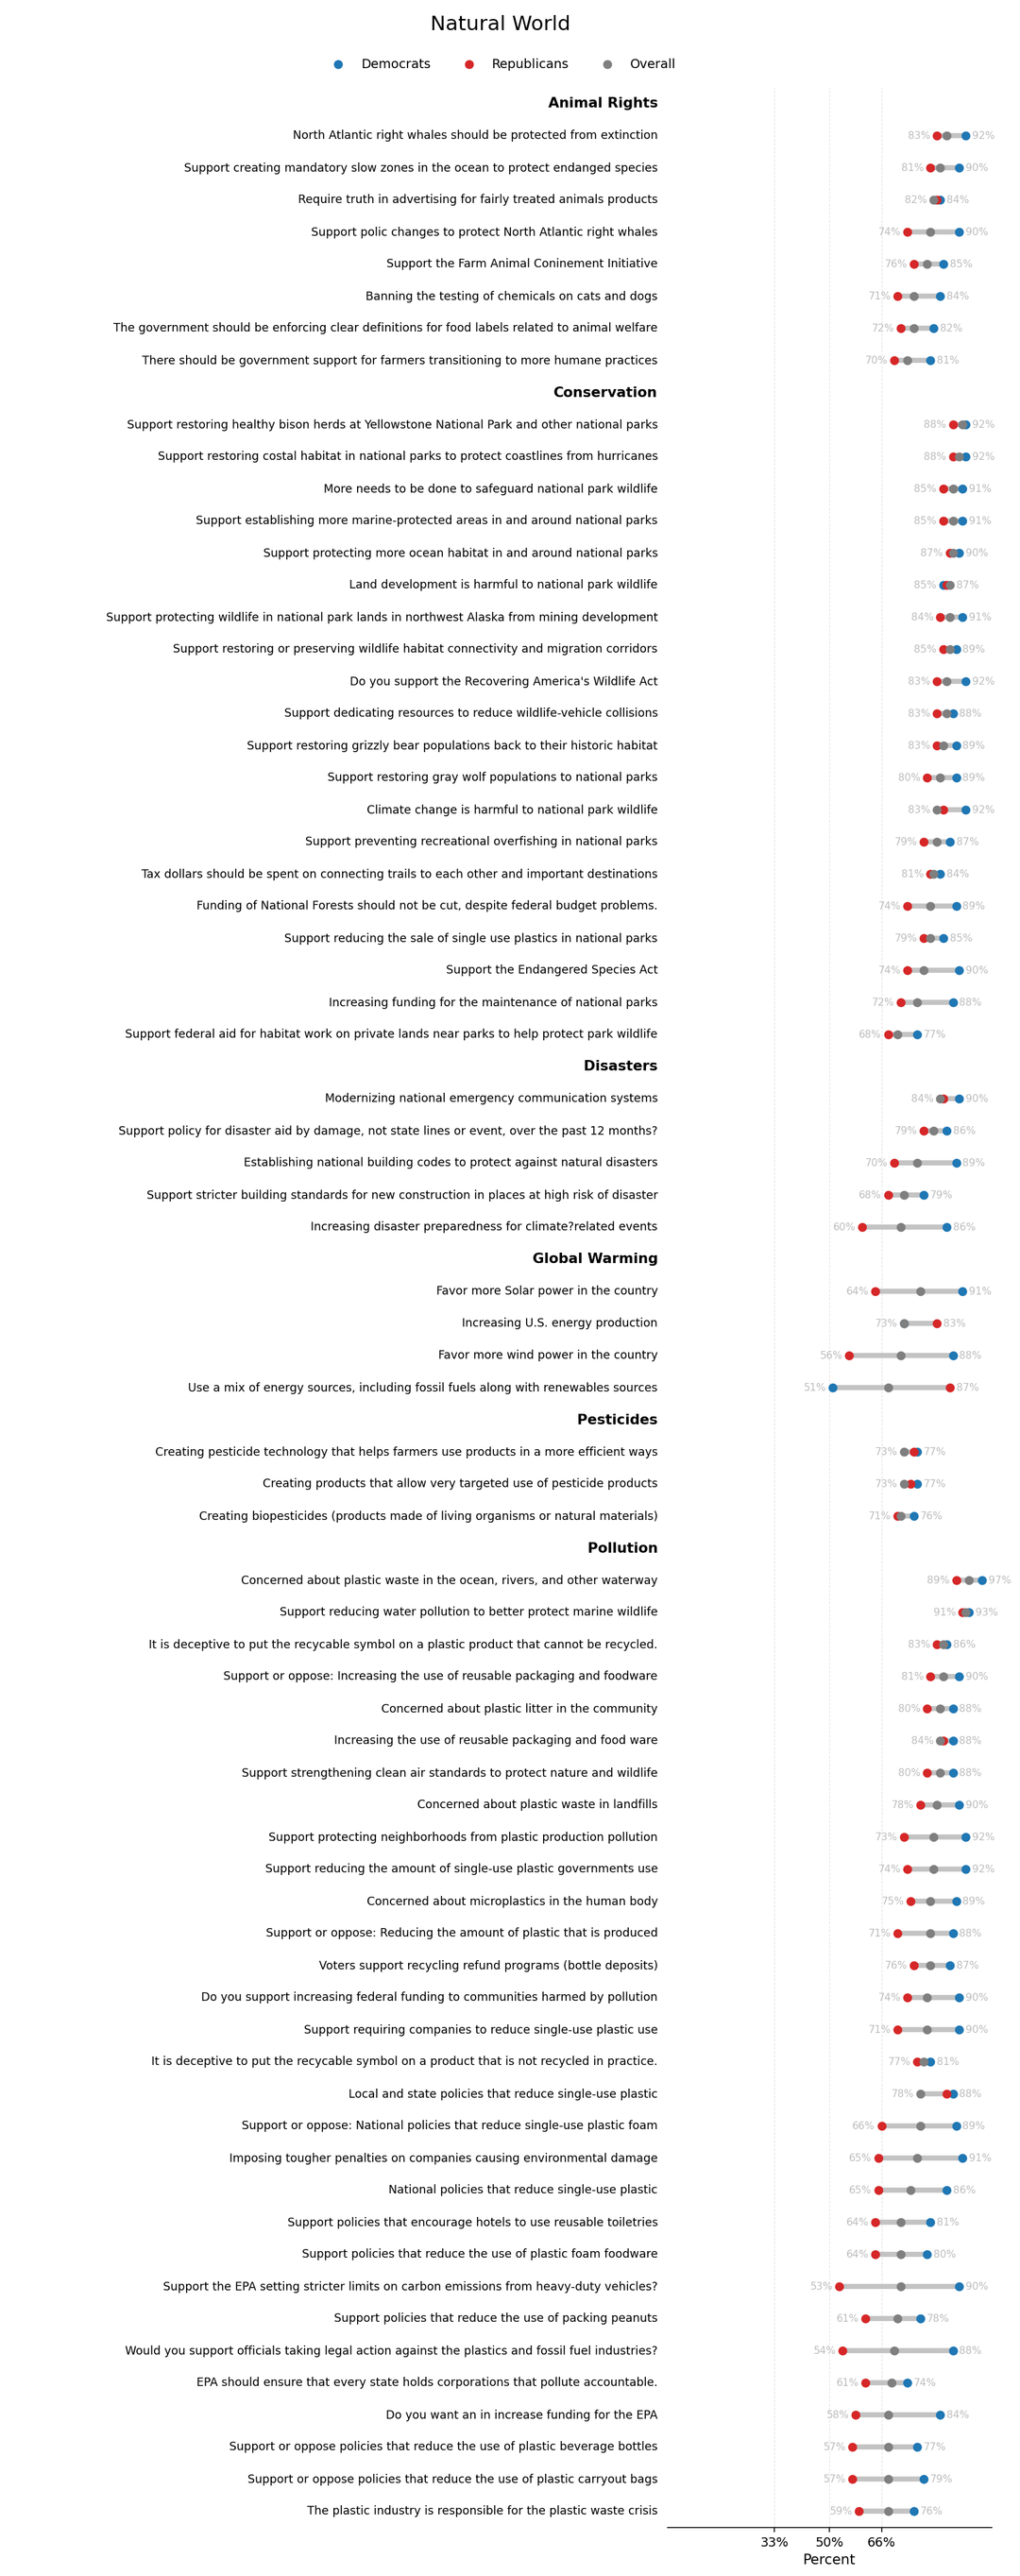
“Increasing U.S. energy production” shows 83% R and 73% overall, with no D dot. The tsv data source has D at 73%, but I can’t figure out how the overall value and one party’s value would be the same (unless R is also that number). **edit**: It’s large numbers of independent respondents. [Here’s the source](https://ygo-assets-websites-editorial-emea.yougov.net/documents/Policy_Support_May_13.pdf) for the energy one. 362 D respondents (73% support), 334 R (83% support), 470 independent (66% support). Weighted average = 73%.
Aggregation and summation would be super duper helpful.
“Allow all eligible voters to register to vote on election day” at 47% tells you all you need to know about the republican caucus
Voter ID has bipartisan majority support. That surprises me.
This data is interesting, but it is not beautiful. Sorry.
This really highlights that you have to drag half the population kicking and screaming to try and accomplish literally any positive change. If you want to maintain the broken status quo then being a conservative is for you. Do they even have any policies that would add a benefit to the life of literally anyone or is it all about taking things away from the other side.
Telling there’s a significant conservative group that don’t believe children should know about consent
VERY interesting, not beautiful
I like this data but it is so far from beautiful in several ways.
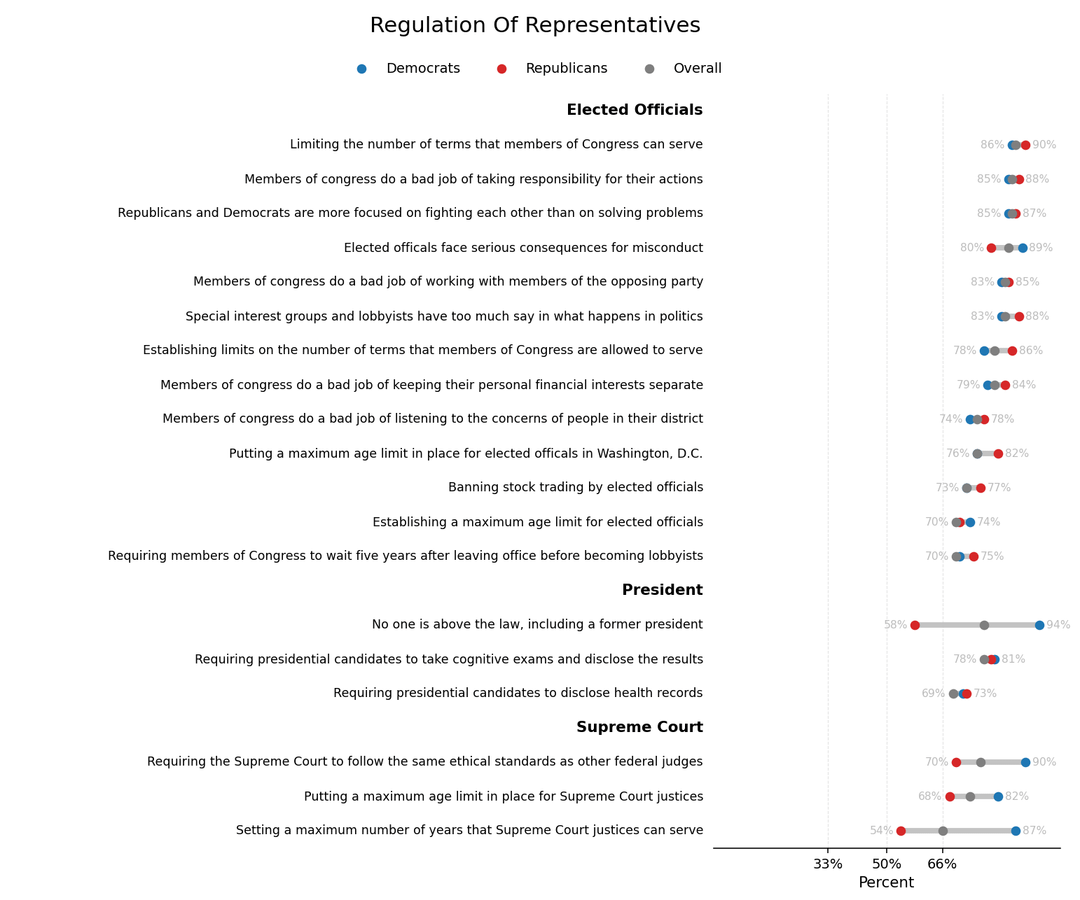
The notion that “nobody is against the law” is a political statement is all anyone needs to know about the current moment
Not commenting on the mechanics or idea, but I found an interesting thing about this poll:
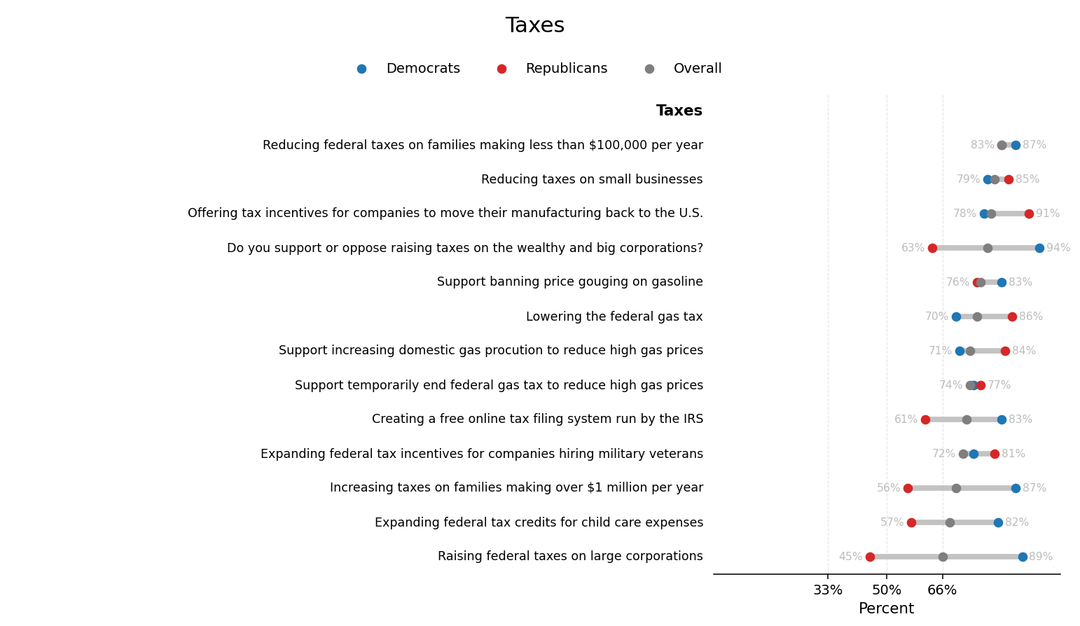
About 80% of questions have more liberal backing than conservative (red dots on the left).
Makes me wonder if questions aren’t biased in some way.
Often you find most agree on the same things. It’s seldom their stance that differs. What often differs is the information they’re presented with. Different groups of people, based on the media they consume, effectively live in two entirely different perceived realities. They act rational and logically within those realities, but the sometimes immense skew and separation of those realities can drive very different conclusions and actions.
Until you fix media, you can’t correct the population.
If the main idea is to convey where people agree, it might be good to somehow highlight the questions people agreed on (using some threshold for the difference) so they’re easy to find while scanning.
So it seems like there’s a lot of topics here where everyone generally approves of. Regardless of political association. Obviously it’s good to see things we do agree with and things we don’t. But I’m skeptical of polls where the numbers are just this high across the board.
This data sucks and is not beautiful
Definitely not beautiful data, unless by ‘beautiful’ you mean ‘painful to look at’.
It’s nice to see all the common opinions. Unfortunately, the one that stood out the most to me was:
> “No one is above the law”
D: 94% agree
R: 58% agree
Where’s the beautiful part?
the first one is already hilarious
“it is important for students to detect false information online”
democrats and republicans agree.
lmaaaaaaao!!
How can you disapprove of funding for kids with disabilities?
Almost all of this boils down to ‘do you want more government or less government involved in your life’
With *very* predictable results.
It’s interesting to see how people respond on specific issues without a lens based on allegiance to a particular party or person applied. It’s almost like we’re being intentionally pitted against one another.
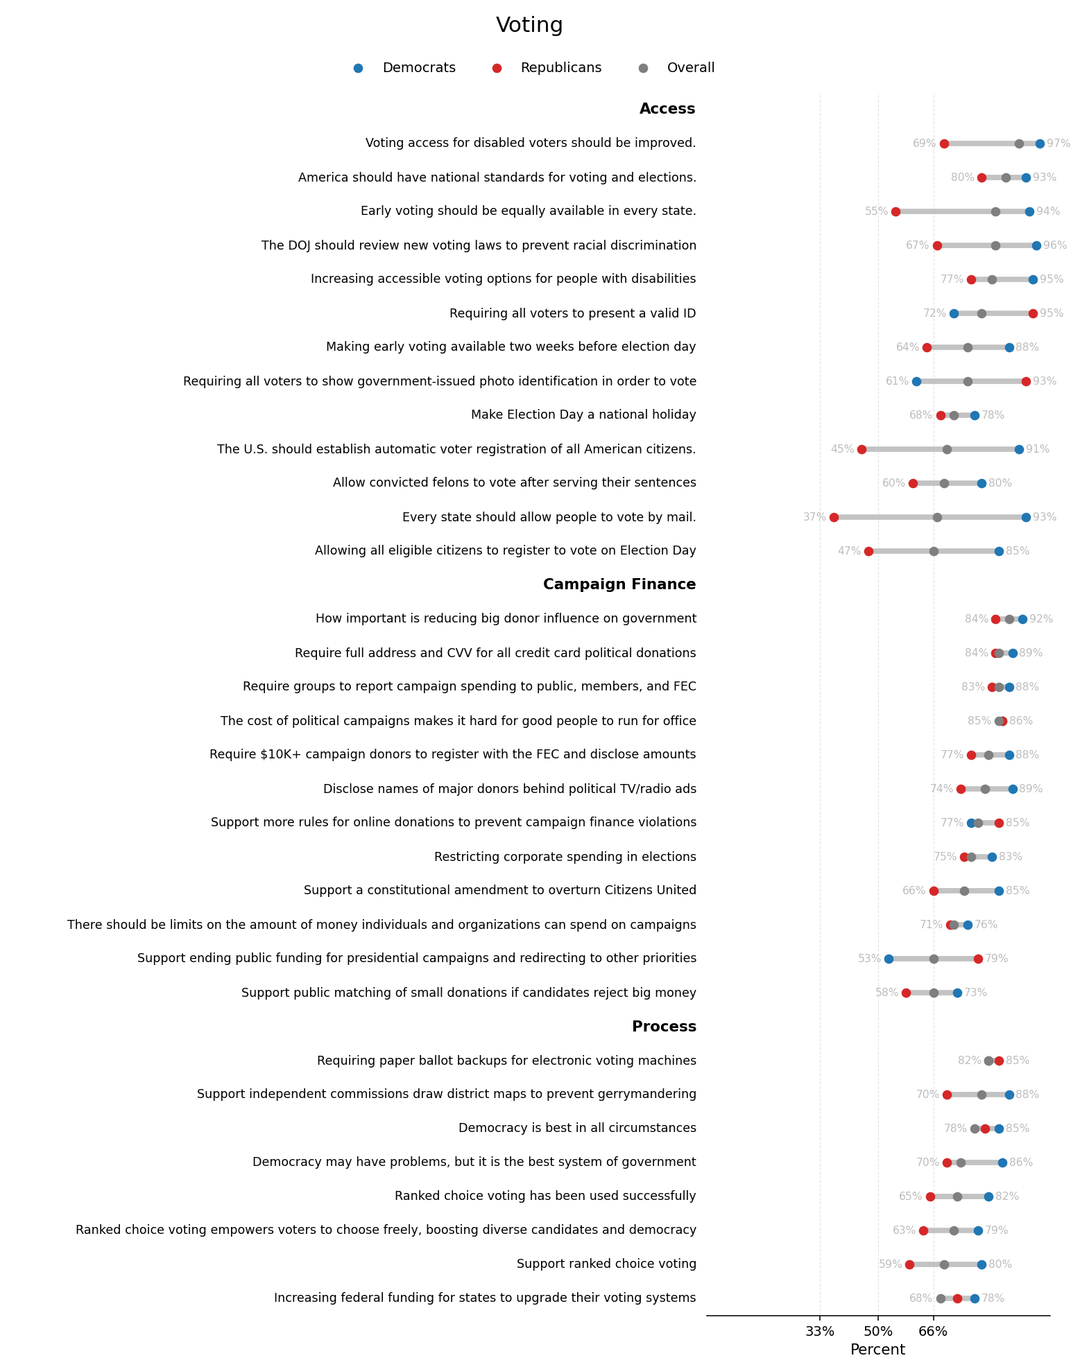
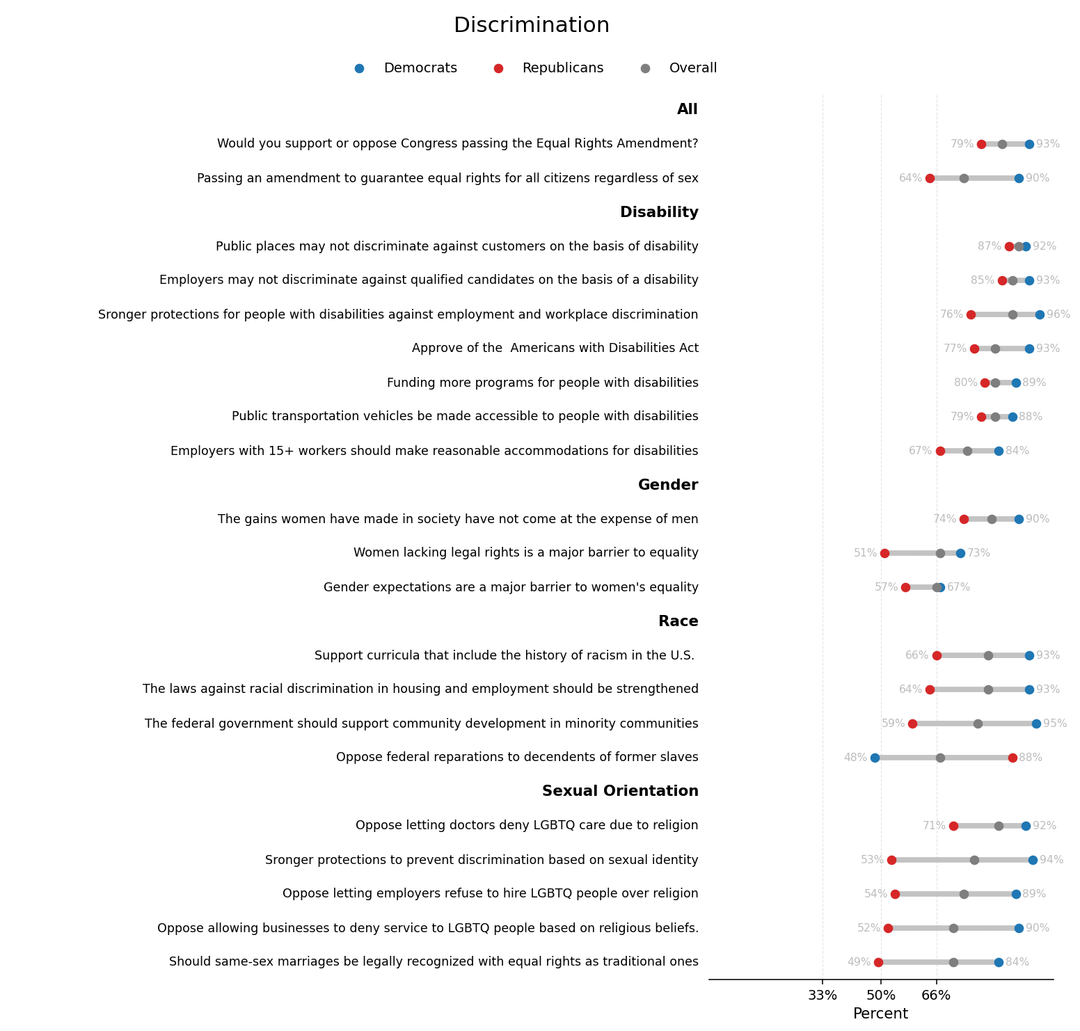
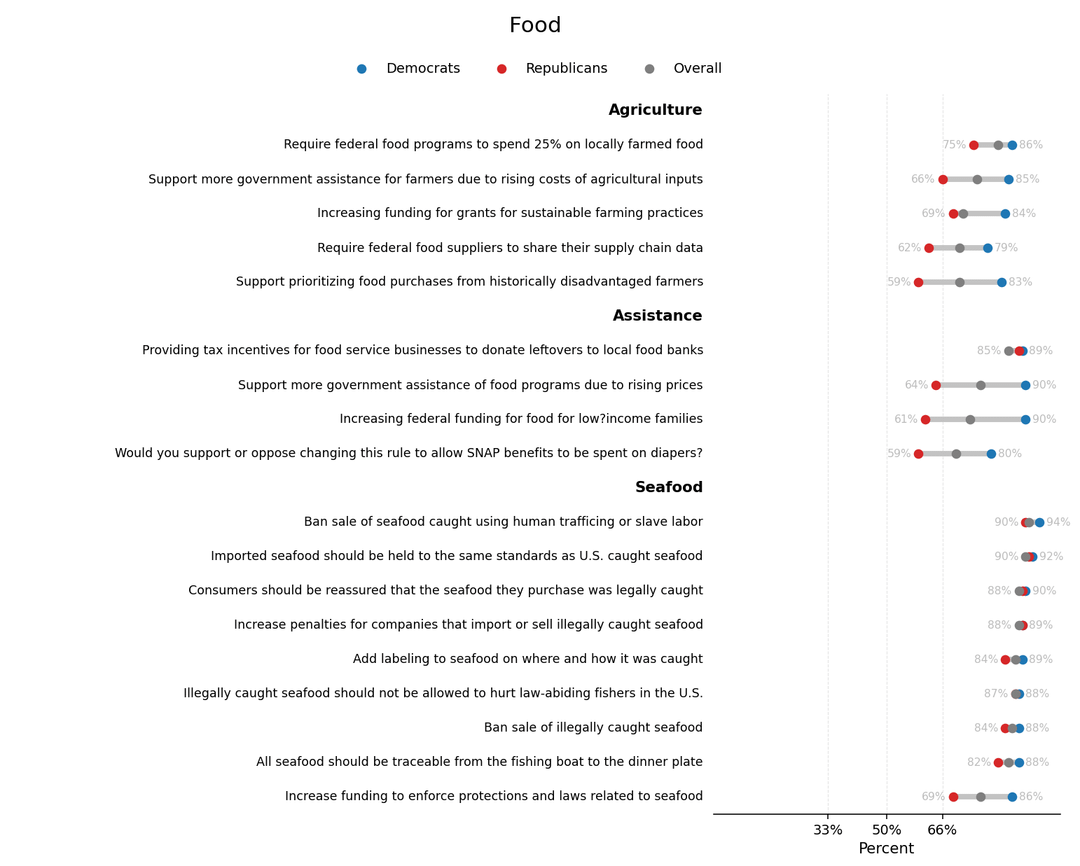
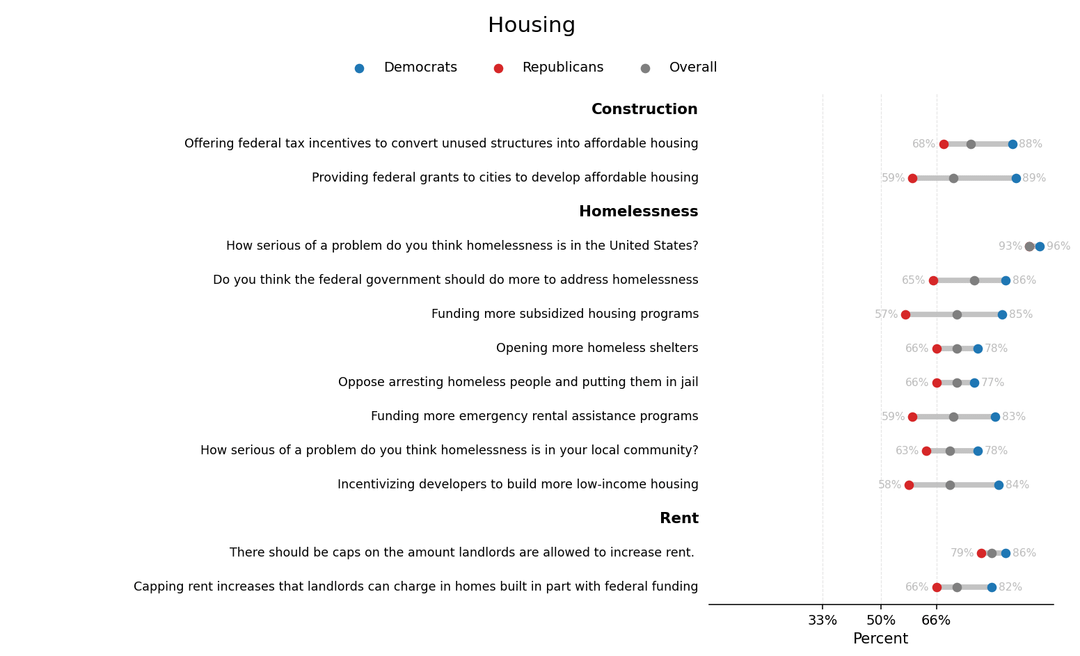
![[OC] Where Americans agree: finding super majority support across 160 polls, 671 questions](https://www.europesays.com/wp-content/uploads/2025/09/nuwicupsa6nf1-1080x1024.png)
31 comments
This project was created to try to find areas where Americans agree and are able to get past partisanship. After searching hundreds of polls, 671 questions were found to have at least 66% support. This data has been compiled into the TwoThirds Platform link below.
Source: [https://agreedupon.solutions/about/twothirds-platform](https://agreedupon.solutions/about/twothirds-platform)
Raw data: [https://agreedupon.solutions/resources/data/twothirds_platform_2025-09-03.tsv](https://agreedupon.solutions/resources/data/twothirds_platform_2025-09-03.tsv)
Tools: python, matplotlib
I have to laugh about the detecting false information ones…
**Labor Relations**
Do you approve or disapprove of labor unions? (56%) <-> (89%)
Do you approve or disapprove of labor unions? (49%) <-> (94%)
wat?!
Data for ants? It is interesting, thank you for compiling it.
Support for labor unions (under labor relations) has two entries with different percentages.
Are you open to feedback on this? It’s difficult to look at something at the top of the image then have to go down to see what the percentage indicators are at the very bottom of the chart. It would be helpful to have the 33/50/66 thing at the top as well.
As with half the posts here, this belongs in a sub called datayoumightfindinteresting not dataisbeautiful
This post approved by the American Optometry Association.
This is not “finding super majority support” because that implies finding bills both sides would support. This is just a list of extremely broad questions. For example, everyone will agree school shootings are bad but sides will differ on supported solutions.
Interesting visualization. Related, I’d love to see where left and right agree/disagree on core problems to be addressed. I’m guessing there is significant alignment on things like gun violence, crime, education, etc. The differences often emerge in the ways that left and right want to solve those issues.
Heads up, there are a *lot* of typos in this dataset.
https://preview.redd.it/p5dwdy2te6nf1.png?width=834&format=png&auto=webp&s=e6224c56341dfcafd27f85d0dccff89f704d144c
There are also some questions that are ambiguous when reporting responses as a %, like “Should public schools require vaccines with exceptions, or not require them at all?” Why not just leave out the final phrase, since the outcome is expressed as % agreement? Or phrase as “as opposed to not requiring them at all” if you want to be specific about the alternative.
“Increasing U.S. energy production” shows 83% R and 73% overall, with no D dot. The tsv data source has D at 73%, but I can’t figure out how the overall value and one party’s value would be the same (unless R is also that number). **edit**: It’s large numbers of independent respondents. [Here’s the source](https://ygo-assets-websites-editorial-emea.yougov.net/documents/Policy_Support_May_13.pdf) for the energy one. 362 D respondents (73% support), 334 R (83% support), 470 independent (66% support). Weighted average = 73%.
Aggregation and summation would be super duper helpful.
“Allow all eligible voters to register to vote on election day” at 47% tells you all you need to know about the republican caucus
Voter ID has bipartisan majority support. That surprises me.
This data is interesting, but it is not beautiful. Sorry.
This really highlights that you have to drag half the population kicking and screaming to try and accomplish literally any positive change. If you want to maintain the broken status quo then being a conservative is for you. Do they even have any policies that would add a benefit to the life of literally anyone or is it all about taking things away from the other side.
Telling there’s a significant conservative group that don’t believe children should know about consent
VERY interesting, not beautiful
I like this data but it is so far from beautiful in several ways.
The notion that “nobody is against the law” is a political statement is all anyone needs to know about the current moment
Not commenting on the mechanics or idea, but I found an interesting thing about this poll:
About 80% of questions have more liberal backing than conservative (red dots on the left).
Makes me wonder if questions aren’t biased in some way.
Often you find most agree on the same things. It’s seldom their stance that differs. What often differs is the information they’re presented with. Different groups of people, based on the media they consume, effectively live in two entirely different perceived realities. They act rational and logically within those realities, but the sometimes immense skew and separation of those realities can drive very different conclusions and actions.
Until you fix media, you can’t correct the population.
If the main idea is to convey where people agree, it might be good to somehow highlight the questions people agreed on (using some threshold for the difference) so they’re easy to find while scanning.
So it seems like there’s a lot of topics here where everyone generally approves of. Regardless of political association. Obviously it’s good to see things we do agree with and things we don’t. But I’m skeptical of polls where the numbers are just this high across the board.
This data sucks and is not beautiful
Definitely not beautiful data, unless by ‘beautiful’ you mean ‘painful to look at’.
It’s nice to see all the common opinions. Unfortunately, the one that stood out the most to me was:
> “No one is above the law”
D: 94% agree
R: 58% agree
Where’s the beautiful part?
the first one is already hilarious
“it is important for students to detect false information online”
democrats and republicans agree.
lmaaaaaaao!!
How can you disapprove of funding for kids with disabilities?
Almost all of this boils down to ‘do you want more government or less government involved in your life’
With *very* predictable results.
It’s interesting to see how people respond on specific issues without a lens based on allegiance to a particular party or person applied. It’s almost like we’re being intentionally pitted against one another.
Comments are closed.