![[OC] HIV diagnoses per 100K people in 2022 by US state](https://www.europesays.com/wp-content/uploads/2025/09/ok5gepobgmof1-1920x1024.png)
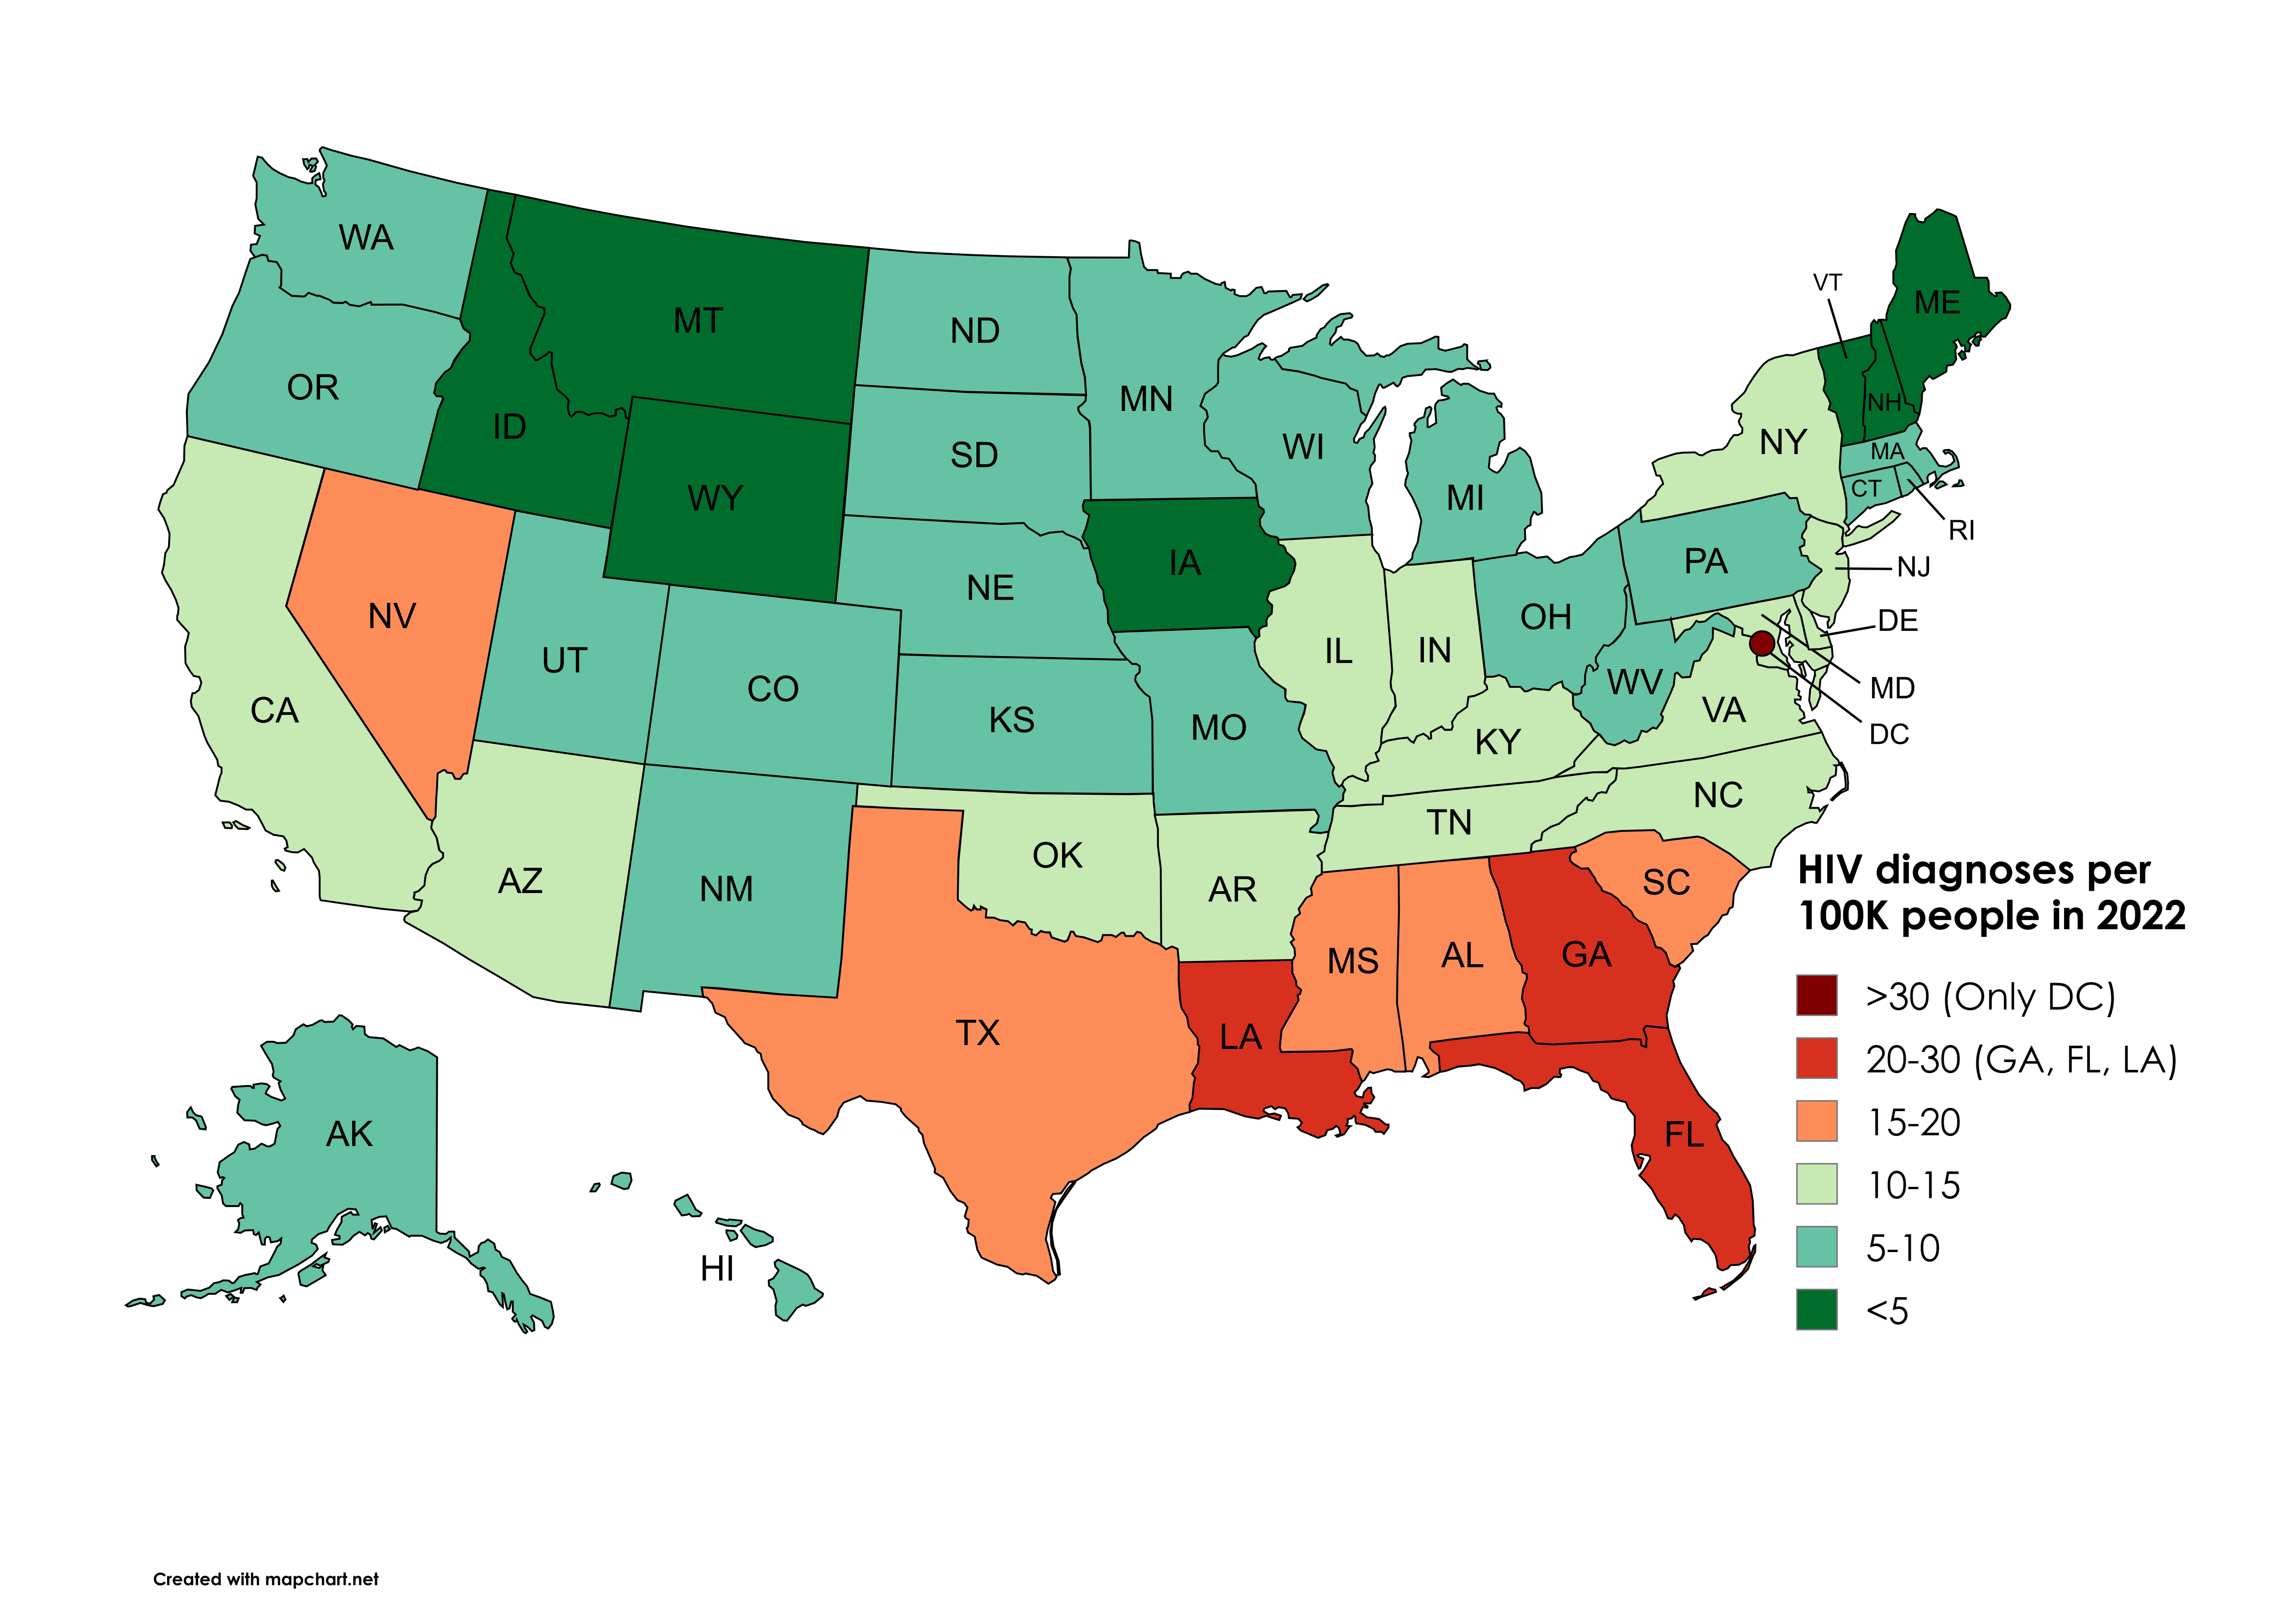
Data: Rates of HIV diagnoses in the United States in 2022, by state; Published by Statista Research Department (https://www.statista.com/statistics/257734/us-states-with-highest-aids-diagnosis-rates/)
Tool: Mapchart: https://www.mapchart.net/usa.html
Posted by snakkerdudaniel
37 comments
Data: Rates of HIV diagnoses in the United States in 2022, by state; Published by Statista Research Department ([https://www.statista.com/statistics/257734/us-states-with-highest-aids-diagnosis-rates/](https://www.statista.com/statistics/257734/us-states-with-highest-aids-diagnosis-rates/))
Tool: Mapchart: [https://www.mapchart.net/usa.html](https://www.mapchart.net/usa.html)
I’m curious to see how this correlates with the per capita use of PrEP treatment in each state among those who engage in risky sex.
I’m surprised. Nebraska normally has one of the higher STD rates in the country.
So they are having a lot of fun on DC aren’t they.
This is the first map I’ve seen where the worst states isn’t either Mississippi or Alabama.
For those of you wondering about the south and DC, it’s because the trend follows where Black people are. They are several times more likely to be diagnosed with it:
[https://minorityhealth.hhs.gov/hivaids-and-blackafrican-americans](https://minorityhealth.hhs.gov/hivaids-and-blackafrican-americans)
Mississippi not last?!?!?!? WOW
Finally like 46th on the list well done
I like how you labeled the key with the states/district that apply to the rarest categories. It solves the confusion of scanning the map looking for which states are at the extreme. I don’t think it scales very well, e.g. if you had 12 states in the top two categories it would be cluttered, but for this visualization it’s very helpful.
what could be possibly happening in DC 😭🙏
Lousiana never disappoints.
Those old people in Florida Yo
States with poor education will always have more issues like this. The states that rank worst in education are almost exclusively red states. It’s not at all surprising that Louisiana, Georgia, and Florida are the worst on this map.
EDIT: I didn’t notice DC. I think my point still stands, though. The south is pretty badly affected.
Keep in mind, this is diagnoses. It is not the same as actual cases, and diseases, especially “shameful” ones, are massively underreported and underdiagnosed in every state of the US.
Smh. We’ve known for decades how HIV is spread. It’s a wimp of a virus that can’t survive long outside a host, and requires some very risky behavior to be transmitted. A couple boxes of condoms and making sure you don’t share needles, and this thing is gone forever. But no….
Why are graphs of the US in so many of the last few posts I’ve seen in this sub so similar.
What happened Mississippi? You’re usually number #1. Don’t be discouraged, you’ll get it next time!
I’m so confused as to why these types of color palette are chosen. Like, for the pale green part, darker means better, but then as it magically transitions to the red part, darker means worse. It’s so confusing.
All those seniors in Florida be fuckin
Still higher than I expected
It’s the same region in the US in every one of these that has the worst stats.
Just look what abstinence-only sex education (or none!) can do!
Hmph , lotta stuff going on in that Bible belt
The dirty south living up to its name
Oh look, it’s *The Map* again.
The b###### the berry, the sweeter the juice
I dislike images like this because the variance is so tight you could realistically paint the whole country one color and give the same general meaning.
Is there a more recent map?
Frustrating to look at the South and see, yet again, that they are bottom of the list. I really like the South but they seem to be doing everything wrong.
Divergent color scheme for unipolar data isn’t beautiful, and using green, a color which denotes “good” or “desirable,” for any number of deaths, is insensitive.
The most anti-science states have higher rates of HIV? Shocking
I am fascinated by how often this account posts, and it feels like whatever random thing they can find that fits into this pre-made US map template.
I need to take a naked tour through Montana just to see what the hell is going on over there :/
apparently the libertarian Rocky Mountain north > the Bible Belt when it comes to avoiding “immorality”
Is there *anything* they do better down there??
Oh man dirty south is right
The South always has the worst stats. That’s telling.
It’s always the same map, no matter the topic. Compare this to the grams of sugar per day that was just posted less than an hour ago. Same map.
There’s still hiv out there?
Comments are closed.