Datawrapper used to map, Excel used for organization and basic calculations to determine share of population.
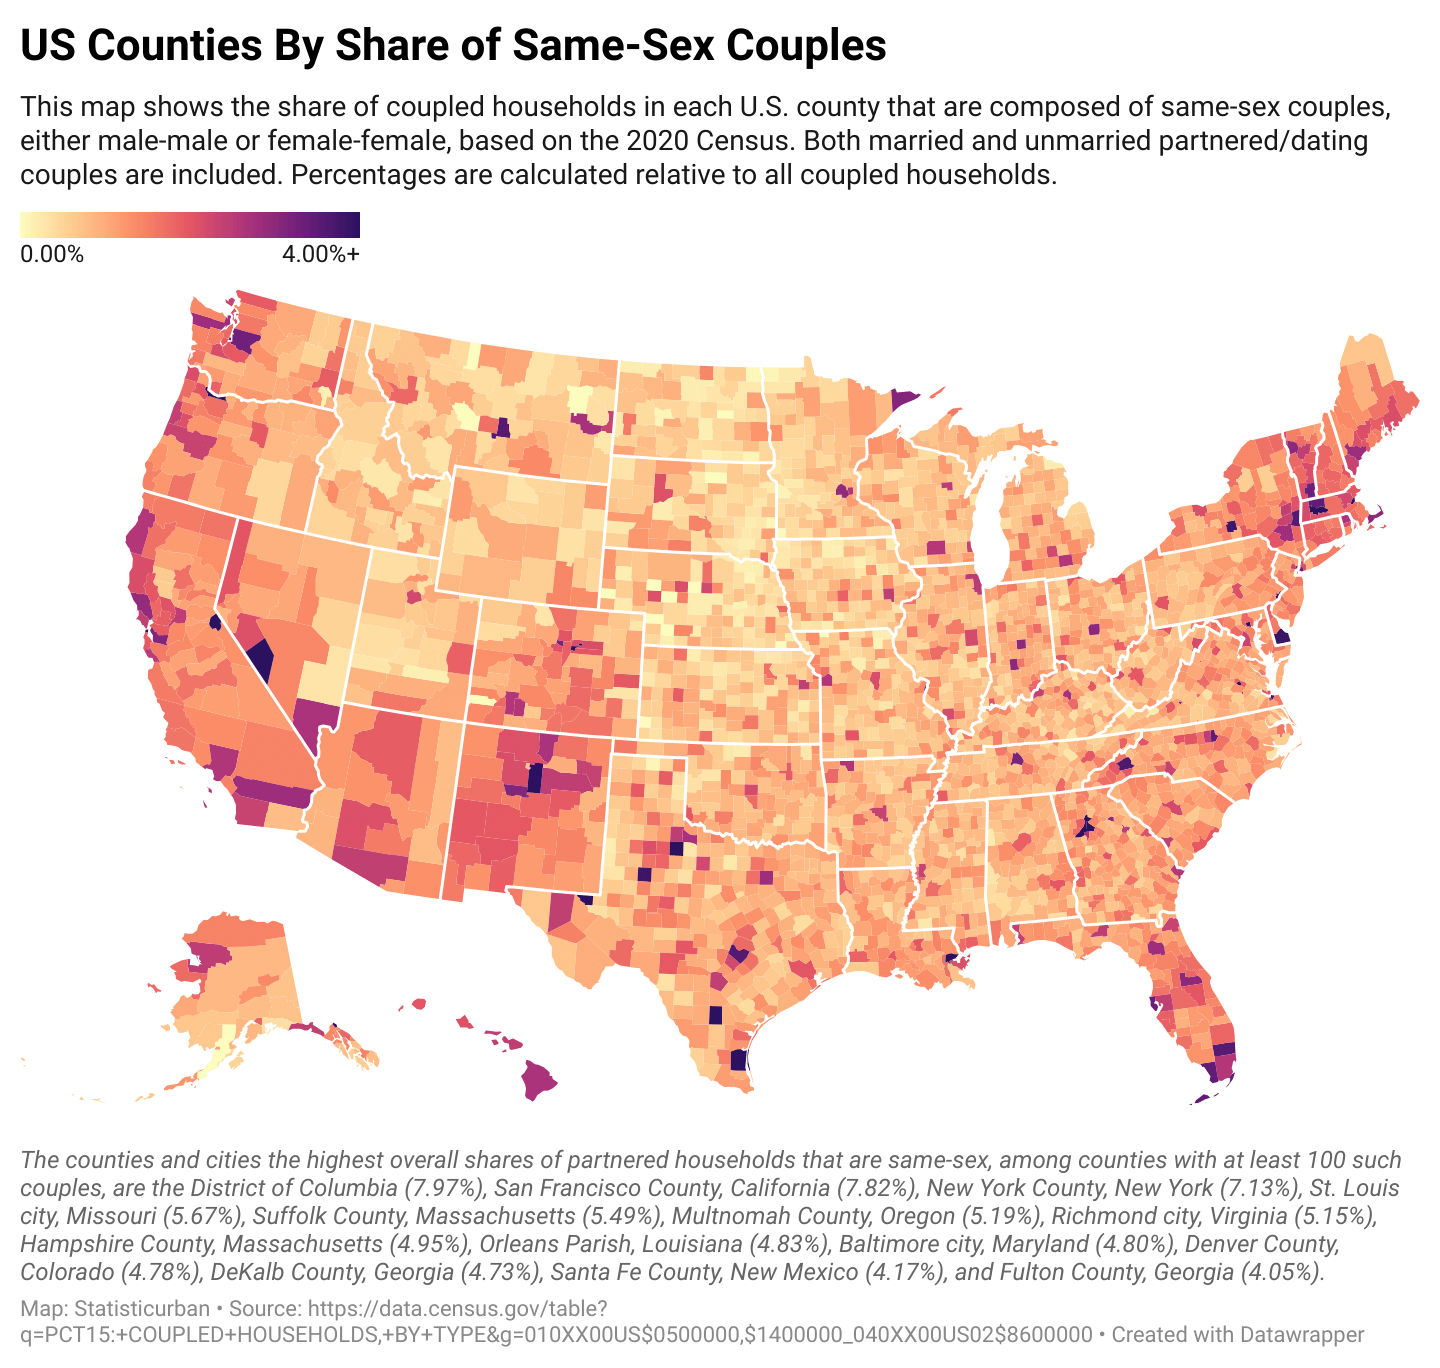
The highest percentages among counties with >100 same-sex couples are the District of Columbia (7.97%), San Francisco County, California (7.82%), New York County, New York (7.13%), St. Louis city, Missouri (5.67%), Suffolk County, Massachusetts (5.49%), Multnomah County, Oregon (5.19%), Richmond city, Virginia (5.15%), Hampshire County, Massachusetts (4.95%), Orleans Parish, Louisiana (4.83%), Baltimore city, Maryland (4.80%), Denver County, Colorado (4.78%), DeKalb County, Georgia (4.73%), Santa Fe County, New Mexico (4.17%), and Fulton County, Georgia (4.05%).
I wonder what percentage of cities/counties had fewer than 100 such couples. I don’t need a list, but is it, 80% of the places? More?
Very curious about Sussex County Delaware, is there a huge gayborhood in Rehoboth I didn’t know about?
Let’s go western Mass! I’m honestly surprised it’s gayer than the cape.
This is largely r/PeopleLiveInCities, no?
Edit: cool stuff! I was wrong yall. Thanks for pointing out some really intriguing oddball counties.
The san fran area has less than I thought?
im actually surprised about new mexico.
I’m confused by the tip of the arrowhead in Minnesota. Gotta be Grand Marais?
Wait I’m confused lol why are there so many of us in the Southwest specifically
What is happening in Esmeralda County, NV, and neighboring Mineral County?
Interesting that one of the few demographic groups Kamala improved with is LGBT voters and that seems to correlated on the county level somewhat. Alpine county California and that southern most county in Delaware both were the only counties in their state that shifted left and they also seem to have a high percentage of Gay and Lesbian couples.
Hampshire County doing its thing.
A bit of trivia regarding the purple dot near Lake Tahoe. That dot is Alpine County, with a population of about 1,200. In 1970, when the county only had about 500 people, there was an idea, or perhaps hoax, called the [Stonewall Nation](https://en.wikipedia.org/wiki/Stonewall_Nation) to turn Alpine County gay by relocating a couple hundred members of team LGBT. The largely conservative residents where aghast, but the plan fell through, as Alpine county was too remote, and as the name suggests, too cold.
Fast forward 50 years, and with Kirkwood, Tahoe, and three national forests nearby, Alpine County is a destination for outdoorsy people, and with that, one of the more liberal and LGBT-tolerant inland counties in California.
Sorry for the ignorant question, how do they tell difference, for example, between two women who haven’t come out and are sharing an apartment and a lesbian couple? This could be construed as a map of acceptance, could it not?
Some of these make sense (urban areas) but then you have random hot spots like these two counties in Montana (Prairie and Golden Valley). Is there an actual gay hub in these counties or is the population so sparse that it’s skewed on the scale? Still interesting though.
• Golden Valley County has a population of 863. The percentage is listed as 3.55% so that would be 30.63
• Prairie County has a population of 1,113. The interactive map lists it at 2.71%, which is 30.16.
Curious about Columbia County in NY (I think that’s Columbia and not Rensselaer,) is it just Hudson that’s making that?
Not surprised at all by Florida. Just walking down Central Ave in St Pete the amount of gay murals/businesses is astounding.
Lots of snark about “people live in cities” but I think this is much more a map of counties with college and resort towns than anything else. Some major metro areas are barely distinguishable by comparison.
I assumed some cities in Texas would light up but I’m surprised about south Texas being a damn Christmas tree.
One I think is fun Is how gay the Mojave is because of Palm Springs lol
Dang Palm Springs really represents
How miami isnt tops ill never know. Maybe this is just couples and miami gays be swingin
Golden Valley County, MT? The population is tiny so I guess it would only take a few to tip the scales.
Man, you can sure tell where Salt Lake City is on this map
Two Georgia counties towards the end of the list is pretty surprising. But D.C. beating SF, like what, I was not expecting that.
And the state with the highest number of super gay counties goes to…..Texas. Fabulous!!!
Lmao Hampshire county, Massachusetts. Unsurprising
Girl, I live in the gayest town in America. It isn’t reflected in the county total, though.
The rare map that defies the “every map of America is the same map: Part XXXX” rule.
I can’t believe christians have been obsessed for my entire life over such a small minority.
![[OC] Gay and Lesbian Couples in the US, Mapped By County](https://www.europesays.com/wp-content/uploads/2025/09/lo4234469tof1-1440x1024.png)
29 comments
Data taken from Census Table PCT15: [https://data.census.gov/table?q=PCT15:+COUPLED+HOUSEHOLDS,+BY+TYPE&g=010XX00US$0500000,$1400000_040XX00US02$8600000](https://data.census.gov/table?q=PCT15:+COUPLED+HOUSEHOLDS,+BY+TYPE&g=010XX00US$0500000,$1400000_040XX00US02$8600000)
Link to interactive map can be found here: [https://datawrapper.dwcdn.net/Ik3wg/3/](https://datawrapper.dwcdn.net/Ik3wg/3/)
Datawrapper used to map, Excel used for organization and basic calculations to determine share of population.
The highest percentages among counties with >100 same-sex couples are the District of Columbia (7.97%), San Francisco County, California (7.82%), New York County, New York (7.13%), St. Louis city, Missouri (5.67%), Suffolk County, Massachusetts (5.49%), Multnomah County, Oregon (5.19%), Richmond city, Virginia (5.15%), Hampshire County, Massachusetts (4.95%), Orleans Parish, Louisiana (4.83%), Baltimore city, Maryland (4.80%), Denver County, Colorado (4.78%), DeKalb County, Georgia (4.73%), Santa Fe County, New Mexico (4.17%), and Fulton County, Georgia (4.05%).
I wonder what percentage of cities/counties had fewer than 100 such couples. I don’t need a list, but is it, 80% of the places? More?
Very curious about Sussex County Delaware, is there a huge gayborhood in Rehoboth I didn’t know about?
Let’s go western Mass! I’m honestly surprised it’s gayer than the cape.
This is largely r/PeopleLiveInCities, no?
Edit: cool stuff! I was wrong yall. Thanks for pointing out some really intriguing oddball counties.
The san fran area has less than I thought?
im actually surprised about new mexico.
I’m confused by the tip of the arrowhead in Minnesota. Gotta be Grand Marais?
Wait I’m confused lol why are there so many of us in the Southwest specifically
What is happening in Esmeralda County, NV, and neighboring Mineral County?
Interesting that one of the few demographic groups Kamala improved with is LGBT voters and that seems to correlated on the county level somewhat. Alpine county California and that southern most county in Delaware both were the only counties in their state that shifted left and they also seem to have a high percentage of Gay and Lesbian couples.
Hampshire County doing its thing.
A bit of trivia regarding the purple dot near Lake Tahoe. That dot is Alpine County, with a population of about 1,200. In 1970, when the county only had about 500 people, there was an idea, or perhaps hoax, called the [Stonewall Nation](https://en.wikipedia.org/wiki/Stonewall_Nation) to turn Alpine County gay by relocating a couple hundred members of team LGBT. The largely conservative residents where aghast, but the plan fell through, as Alpine county was too remote, and as the name suggests, too cold.
Fast forward 50 years, and with Kirkwood, Tahoe, and three national forests nearby, Alpine County is a destination for outdoorsy people, and with that, one of the more liberal and LGBT-tolerant inland counties in California.
Sorry for the ignorant question, how do they tell difference, for example, between two women who haven’t come out and are sharing an apartment and a lesbian couple? This could be construed as a map of acceptance, could it not?
Some of these make sense (urban areas) but then you have random hot spots like these two counties in Montana (Prairie and Golden Valley). Is there an actual gay hub in these counties or is the population so sparse that it’s skewed on the scale? Still interesting though.
https://preview.redd.it/sqap1he0mtof1.jpeg?width=1123&format=pjpg&auto=webp&s=a0d1f0f849556e66819e1db056b25b28d04da634
EDIT: So using the population totals from 2024 as well as the interactive map shared in another comment:
[https://datawrapper.dwcdn.net/Ik3wg/3/](https://datawrapper.dwcdn.net/Ik3wg/3/)
• Golden Valley County has a population of 863. The percentage is listed as 3.55% so that would be 30.63
• Prairie County has a population of 1,113. The interactive map lists it at 2.71%, which is 30.16.
Curious about Columbia County in NY (I think that’s Columbia and not Rensselaer,) is it just Hudson that’s making that?
Not surprised at all by Florida. Just walking down Central Ave in St Pete the amount of gay murals/businesses is astounding.
Lots of snark about “people live in cities” but I think this is much more a map of counties with college and resort towns than anything else. Some major metro areas are barely distinguishable by comparison.
I assumed some cities in Texas would light up but I’m surprised about south Texas being a damn Christmas tree.
One I think is fun Is how gay the Mojave is because of Palm Springs lol
Dang Palm Springs really represents
How miami isnt tops ill never know. Maybe this is just couples and miami gays be swingin
Golden Valley County, MT? The population is tiny so I guess it would only take a few to tip the scales.
Man, you can sure tell where Salt Lake City is on this map
Two Georgia counties towards the end of the list is pretty surprising. But D.C. beating SF, like what, I was not expecting that.
And the state with the highest number of super gay counties goes to…..Texas. Fabulous!!!
Lmao Hampshire county, Massachusetts. Unsurprising
Girl, I live in the gayest town in America. It isn’t reflected in the county total, though.
The rare map that defies the “every map of America is the same map: Part XXXX” rule.
I can’t believe christians have been obsessed for my entire life over such a small minority.
Comments are closed.