Well the employment to actual output seems to be delayed by about 6 to 7 years, so it is more like the output has surged by a bit more then 2x but the industry jobs haven’t grown.
So, profits for oil companies but not for employees?
i wonder how much automation plays a role in this.
Would be nice to see a line added that showed capital expenditures as well. In some other mining and energy sectors it’s the initial investments where you see a lot of employment growth (related to engineering and infrastructure construction). Once the mines, and potentially the oil wells in this case, are up and running, investment falls off a lot and so do those engineering and construction jobs.
The series don’t look related prior to 2008, so why imply that anything changed after 2008?
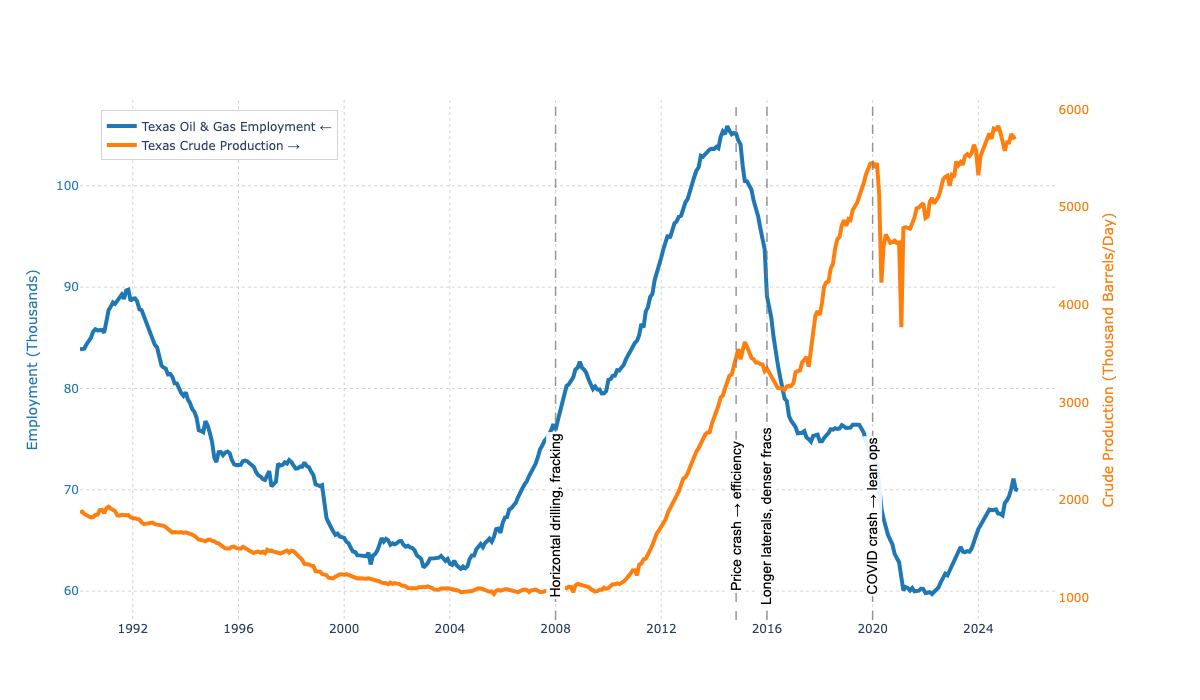
WTF is these Y axis? Cant see at a glance either absolute or relative numbers cause both Y axis has inconsistent starting points.
Downvoted, because not beautiful info viz. Those y axes are wild. Left, 60->100, right 1000->6000. We are shown fluctuations in different relative magnitudes but the data is presented as the same relative magnitude.
Automation eventually reaches everywhere.
Productivity and automation ( ˘ ³˘)♥
I would guess a lot of the infrastructure was also in place post COVID for ramping up. No need to hire new drill crews when the tap had just been switched off and could be switched on again. The increase in hiring seems to coincide with renewed increase in production from 2021 onwards, but production is still below COVID so a probably still a lot of untapped “easy” production with minimal employee ramp-up needed.
So output has risen but employment numbers haven’t?
Just like manufacturing, agriculture, and a ton of other industries?
Looks like a lagging indicator to me. Perhaps drillers (80K) drilled new wells, then were fired. Some of them would be rehired as frackers (60K) and now the companies are employing more drillers as the fields are near peak.
Well it’s just a guess, but you can tell a lot from a lagging indicator. Whereas a coincident indicator doesn’t tell you which is cause and which is effect.
This graph is no bueno. If you zoom out and allow the proper scale to zero, it’s much less dramatic.
They have a pile of untapped wells all over the US. They don’t have to drill more to increase production. Most of my friends moved out of the drilling industry.
Proponents of drilling more oil would always tell us “it creates American jobs.” Now all it does is create wealth for not the middle class.
In 2008, we started to use frack sleeves and more frac plugs. The spacing and location of these tools was way more random than today where its optimized in spacing, size, proppant volume and more. In addition, pumping horsepower has become more efficient along with choking a well upon production to keep wells producing longer.
The amount of jobs needed to develop a new well is about 7x the jobs to keep an existing well producing. So tons of people were needed to ramp up drilling activity then followed by a slow bleed.
As to why, there are a lot of factors at play.
Investors have slowly exited oil and gas, thus, a lot of smaller companies do not have access to capital to grow.
Larger companies are buying the mid sized and smaller companies and just holding on to their acreages.
Market conditions are not favorable. Oil prices always fluctuate, inventory degration, steel tariffs, and more oil supply in the global market, activity has really slowed down.
When companies are not drilling much and uncertain about profitability, mass layoffs start happening (see CVX and COP).
There’s also not much incentive for young talent to join the oil and gas industry. Similarly, companies just aren’t putting resources to develop employees since a layoff is always the “easiest way to cut costs”.
Tldr; slowed development activity = layoffs
Source: long time engineer in o&g
Setting up a an oil rig takes a lot more workers than running one.
Did they account for increases in transportation and refining jobs in these stats?
19 comments
Source: BLS and EIA, Tools: Python and Plotly
Well the employment to actual output seems to be delayed by about 6 to 7 years, so it is more like the output has surged by a bit more then 2x but the industry jobs haven’t grown.
So, profits for oil companies but not for employees?
i wonder how much automation plays a role in this.
Would be nice to see a line added that showed capital expenditures as well. In some other mining and energy sectors it’s the initial investments where you see a lot of employment growth (related to engineering and infrastructure construction). Once the mines, and potentially the oil wells in this case, are up and running, investment falls off a lot and so do those engineering and construction jobs.
The series don’t look related prior to 2008, so why imply that anything changed after 2008?
WTF is these Y axis? Cant see at a glance either absolute or relative numbers cause both Y axis has inconsistent starting points.
Downvoted, because not beautiful info viz. Those y axes are wild. Left, 60->100, right 1000->6000. We are shown fluctuations in different relative magnitudes but the data is presented as the same relative magnitude.
Automation eventually reaches everywhere.
Productivity and automation ( ˘ ³˘)♥
I would guess a lot of the infrastructure was also in place post COVID for ramping up. No need to hire new drill crews when the tap had just been switched off and could be switched on again. The increase in hiring seems to coincide with renewed increase in production from 2021 onwards, but production is still below COVID so a probably still a lot of untapped “easy” production with minimal employee ramp-up needed.
So output has risen but employment numbers haven’t?
Just like manufacturing, agriculture, and a ton of other industries?
Looks like a lagging indicator to me. Perhaps drillers (80K) drilled new wells, then were fired. Some of them would be rehired as frackers (60K) and now the companies are employing more drillers as the fields are near peak.
Well it’s just a guess, but you can tell a lot from a lagging indicator. Whereas a coincident indicator doesn’t tell you which is cause and which is effect.
This graph is no bueno. If you zoom out and allow the proper scale to zero, it’s much less dramatic.
They have a pile of untapped wells all over the US. They don’t have to drill more to increase production. Most of my friends moved out of the drilling industry.
Proponents of drilling more oil would always tell us “it creates American jobs.” Now all it does is create wealth for not the middle class.
In 2008, we started to use frack sleeves and more frac plugs. The spacing and location of these tools was way more random than today where its optimized in spacing, size, proppant volume and more. In addition, pumping horsepower has become more efficient along with choking a well upon production to keep wells producing longer.
The amount of jobs needed to develop a new well is about 7x the jobs to keep an existing well producing. So tons of people were needed to ramp up drilling activity then followed by a slow bleed.
As to why, there are a lot of factors at play.
Investors have slowly exited oil and gas, thus, a lot of smaller companies do not have access to capital to grow.
Larger companies are buying the mid sized and smaller companies and just holding on to their acreages.
Market conditions are not favorable. Oil prices always fluctuate, inventory degration, steel tariffs, and more oil supply in the global market, activity has really slowed down.
When companies are not drilling much and uncertain about profitability, mass layoffs start happening (see CVX and COP).
There’s also not much incentive for young talent to join the oil and gas industry. Similarly, companies just aren’t putting resources to develop employees since a layoff is always the “easiest way to cut costs”.
Tldr; slowed development activity = layoffs
Source: long time engineer in o&g
Setting up a an oil rig takes a lot more workers than running one.
Did they account for increases in transportation and refining jobs in these stats?
Comments are closed.