
Satellite imagery includes data widely used to analyze how well vegetation is growing on the ground. This material is called “Global Vegetation Index (Global NDVI)” imagery. A key example is “eVIIRS NDVI” data captured by the U.S. National Oceanic and Atmospheric Administration (NOAA)’s JPSS satellite. This system photographs the entire world daily and creates composite images every 10 days using only the highest vegetation index values. The data is available through the U.S. Geological Survey (USGS) EarthExplorer website.
I used Global Vegetation Index (eVIIRS NDVI) imagery with 375-meter resolution to examine North Korea’s 2025 crop conditions. My analysis showed this year’s farmland vegetation index decreased slightly compared to last year (from 0.834 to 0.813). The vegetation index difference is 0.021, which represents a minimal change. We categorized overall crop growth into three levels: good, average, and poor. This year’s crop growth appears similar to last year or slightly worse. I estimate that North Korea’s 2025 harvest will be similar to last year’s or decrease by a small amount.
This study represents a basic analysis using only vegetation index satellite imagery. A precise assessment would require comprehensive analysis combining multiple data sources including soil conditions, weather, climate, pesticide and fertilizer use, and trade statistics.
As the fall harvest season approaches, this study used Global Vegetation Index imagery to roughly assess conditions across North Korea. Here’s how I analyzed the vegetation index imagery.
North Korean farmland and vegetation index imagery
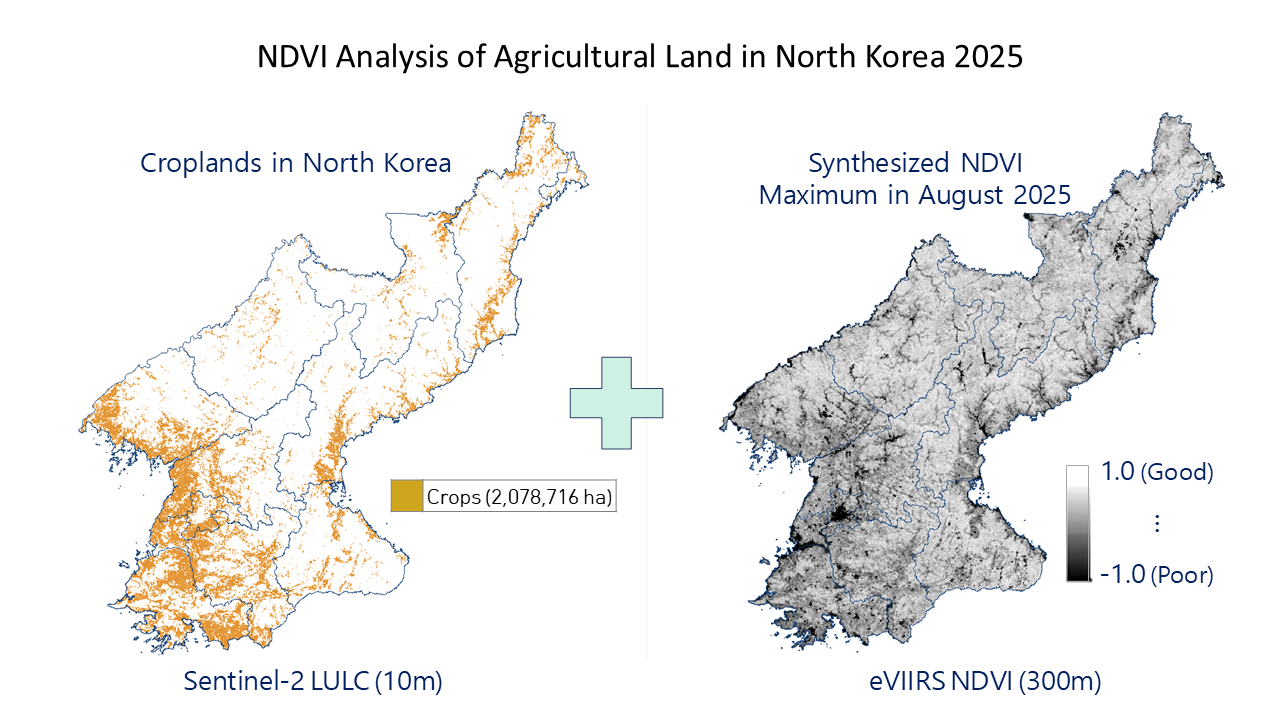 To evaluate North Korea’s 2025 crop growth, I combined farmland distribution maps with Global Vegetation Index imagery. (Sentinel-2 Land Use, eVIIRS NDVI)
I first obtained a map showing where North Korea’s farmland is located. This data came from the 2024 Global Land Use dataset provided by U.S. company ESRI, which covers 2017-2024. I extracted only the farmland areas from this dataset. The resolution is 10 meters, created using Sentinel-2 satellite data. This provides better precision than NASA’s 500-meter resolution Global Land Use data.
The farmland map showed North Korea has approximately 2.08 million hectares of cultivated land. This differs by 150,000 hectares from the 1.93 million hectares reported by the North Korea Support Information System. Upon closer examination, I found that salt fields were incorrectly included as farmland. Farmland should be classified as agricultural land for growing crops, while salt fields should be classified as industrial facilities for salt production. Salt fields look similar to rice paddies in satellite images, making them easy to confuse. If I exclude salt fields, North Korea’s cultivated area would match the Support Information System data more closely.
The imagery shows North Korea extracted from Global Vegetation Index data. This represents the highest values from Aug. 1-31, 2025, with 375-meter resolution. We used a “Maximum Value Composite” technique for combining the data. We compile only the highest values from a month’s worth of data to eliminate errors from clouds or shadows—things that aren’t actually vegetation. Vegetation index values range from -1.0 to 1.0. Healthy vegetation approaches 1.0, while non-vegetation items show low values close to -1.0.
I analyzed North Korea’s farmland vegetation index using only August imagery. Crop vegetation indices typically peak in mid-August, then gradually decrease until harvest as growth slows. For satellite-based crop analysis, mid-August vegetation data provides the most appropriate timing.
Below, I used Global Vegetation Index imagery to compare this year’s and last year’s crop growth conditions for North Korean farmland, shown in colored figures and tables with statistics.
North Korean farmland vegetation index growth comparision (2024 vs. 2025)
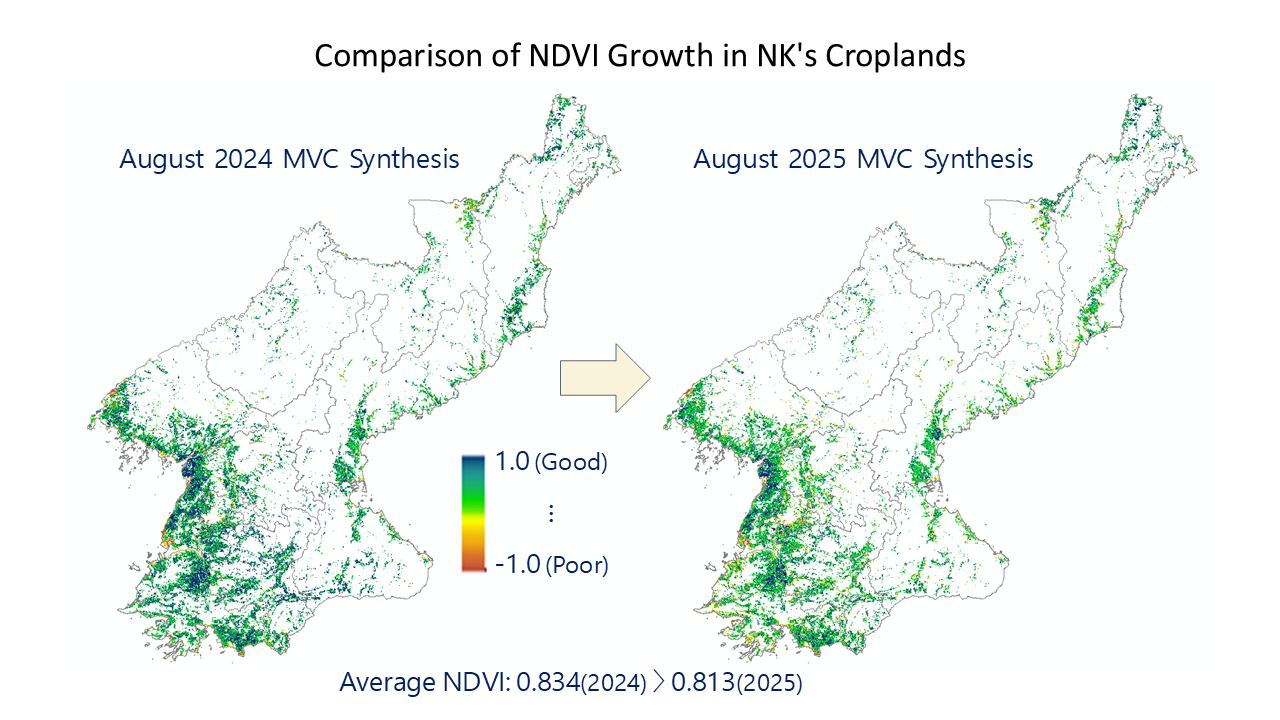 Using August Global Vegetation Index imagery, we analyzed and compared North Korean crop growth between last year and this year. (eVIIRS NDVI analysis)
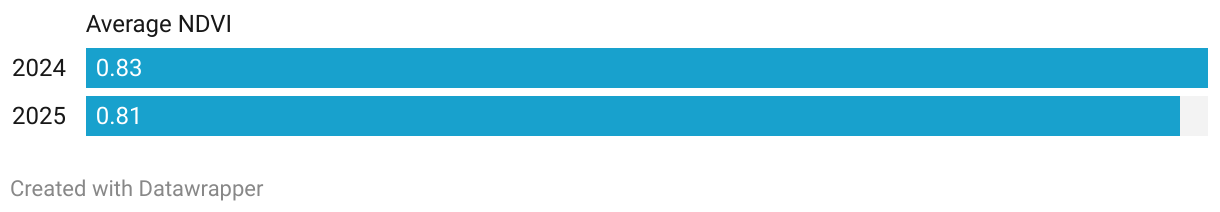
Comparing average vegetation indices for North Korean farmland between August 2024 and August 2025, this year (0.813) showed a decrease of 0.021 compared to last year (0.834). Considering analytical uncertainty, this difference is minimal, and this year’s crop growth appears nearly identical to last year’s.
According to Wikipedia, crop vegetation indices above 0.6 indicate good growth, values below 0.3 show poor growth, and values between 0.3-0.6 represent average conditions. Using these standards, I categorized North Korean farmland crop growth into three levels, shown in the table below.
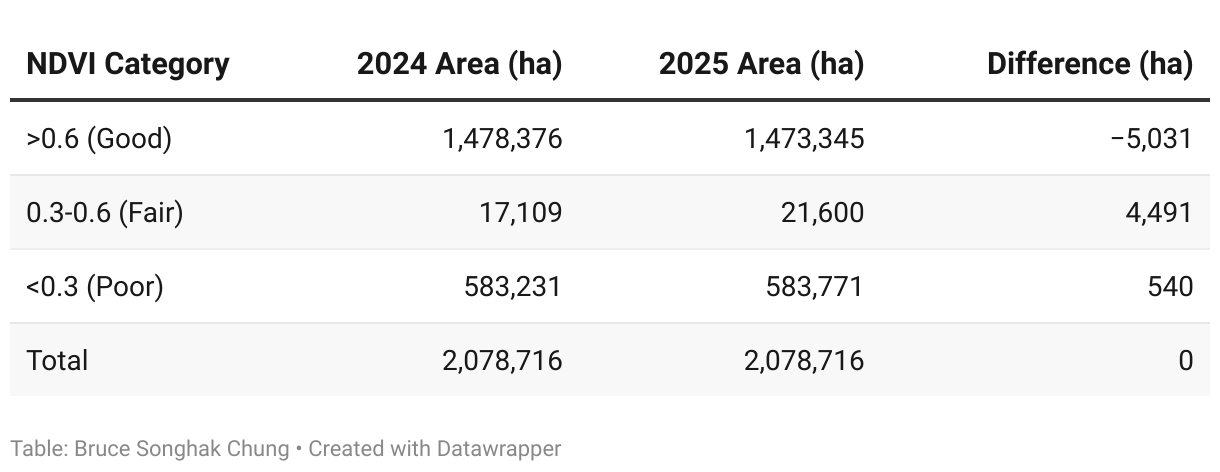
The table shows that areas with good growth decreased by 5,031 hectares this year compared to last year, while areas with average and poor growth increased by 4,491 and 540 hectares respectively. This year’s farmland crop growth appears somewhat weaker than last year’s. Given the total cultivated area of approximately 2.08 million hectares, these area changes represent minimal differences.
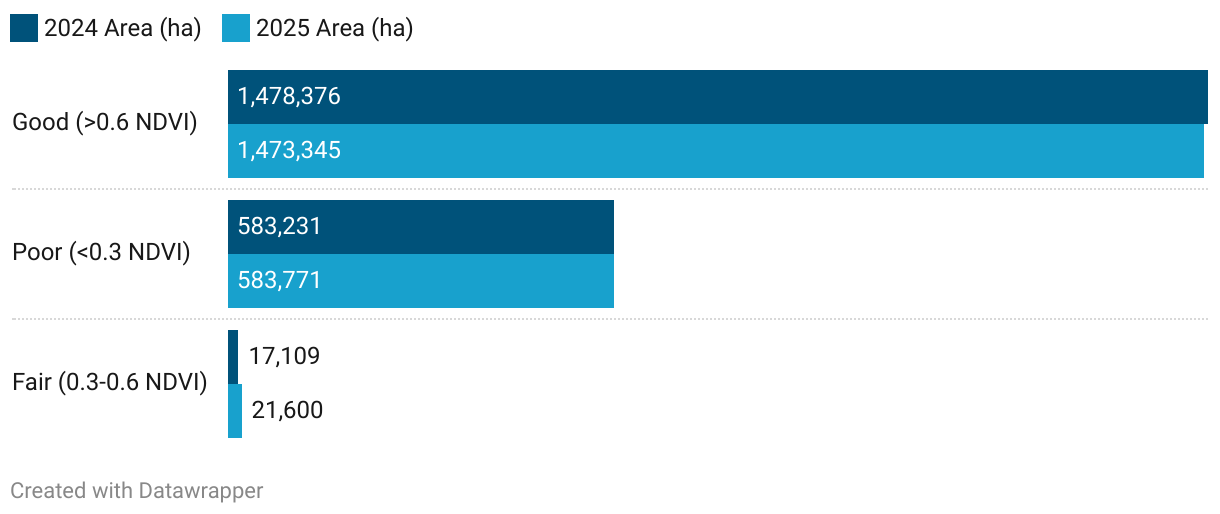
The graphs below also show this year’s farmland crop conditions are slightly underperforming compared to last year. This year’s average vegetation index is 0.021 lower than last year’s. Overall, while this year’s North Korean crop conditions approach last year’s level, I expect a slight harvest decrease. This year’s North Korean crop harvest likely won’t exceed last year’s.
Reports suggest this year’s North Korean crop outlook appears unfavorable due to several factors: low spring temperatures, insufficient rainfall, and delayed rice planting. Problems included poor fertilizer and pesticide supply during the growing season, rice seedling damage and stunted growth from spring cold, reduced reservoir water from spring drought, and rice planting delayed about 20 days beyond normal, finishing around late June. One variable remains: possible autumn typhoons. These unwelcome seasonal visitors could affect Korean Peninsula crop conditions and harvests.